A chain is only as strong as its weakest link.
What is the weakest leak in your business process?
In this blog post, we’ll explore how to use Camunda Optimize to leverage best practices from the manufacturing industry to find and fix problems in your business processes scientifically.
The Theory of Constraints
Dr. Eliyahu Goldratt invented and then popularized the Theory of Constraints (TOC) In his 1984 book The Goal. The main idea is that every process has one constraint that limits its flow. I’ll use “constraint” and “bottleneck” interchangeably through this blog post.
It’s the slow walker in a group of tourists.
It’s the overworked teammate that everyone asks for help.
It’s the manual process where everything else is automated.
Sometimes, it’s a literal bottleneck.
The Theory of Constraints introduces two rules about process performance, specifically process throughput.
- The constraint limits throughput.
- Any improvements outside the constraint will not lead to improved process performance.
In other words, if you want to improve a process’s throughput, you only have to improve performance at the constraint.
You don’t make your team more productive by giving more work to the person who already has a massive backlog of requests.
Here’s a quick example from Tiago Forte, a productivity expert.
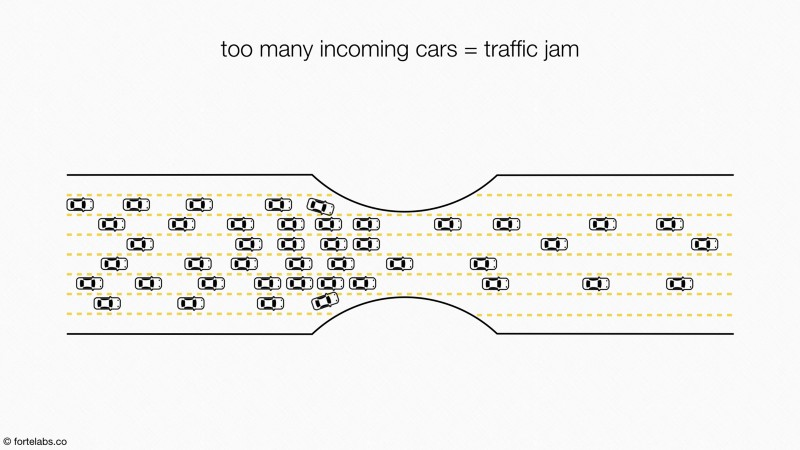
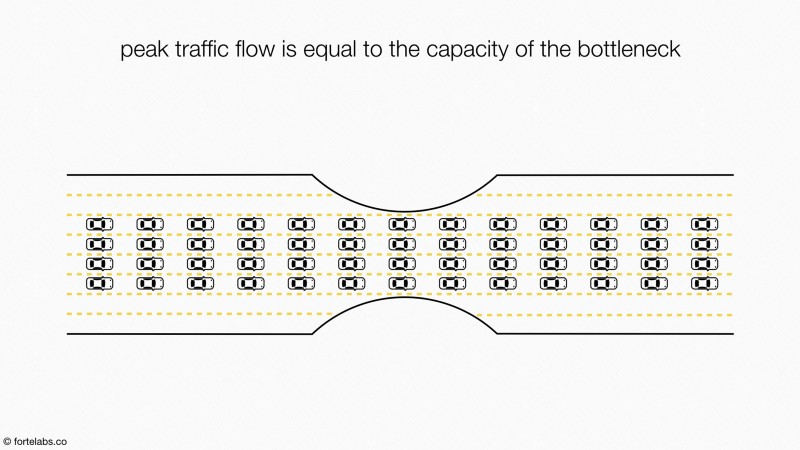
He uses the analogy of lanes of traffic in a highway to describe bottlenecks.
Using all available lanes in a highway before half of them are closed off will cause merging traffic to slow down.
However, with the smooth flow of traffic, the capacity of the bottleneck increases substantially.
But how do you identify the bottleneck?
And what can you do to fix it?
Let’s switch to Optimize.
Optimize and the Five Focusing Steps
The Theory of Constraints provides a framework called the Five Focusing Steps, a Process of On-Going Improvement.
We’re assuming you’re running Optimize 3.6.0, which includes the latest dashboard templates to help you recreate this workflow with zero configuration. If you don’t have Optimize, here’s a quick guide on how to install it.
Step 1: Identify the constraint
Optimize is purpose-built for helping you rapidly identify the constraints of your system. In a new collection, create a Human Task Bottleneck Analysis dashboard. This dashboard is available with Optimize 3.6.0, so you’ll need to upgrade to get this configuration. Screenshots will also be provided below so you can recreate each of these reports on older versions.
I’ll demonstrate the process of identifying your bottleneck and share sample visualizations.
Where is my constraint?
The first step is to discover the source of the bottleneck.
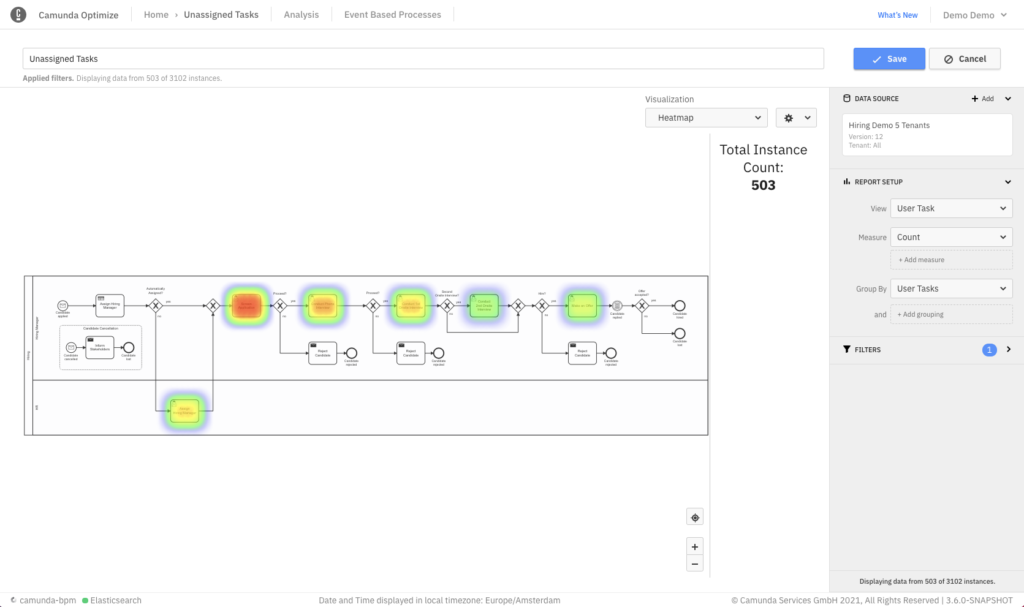
One way to identify a bottleneck is to see where work is piling up. You can visualize this using the Unassigned Tasks heatmap, which shows how many unassigned tasks are waiting at each flow-node. You can create this by viewing the user task count, grouping by user tasks, filtering to show flow-nodes with an assignee of “unassigned” and selecting the heatmap visualization.
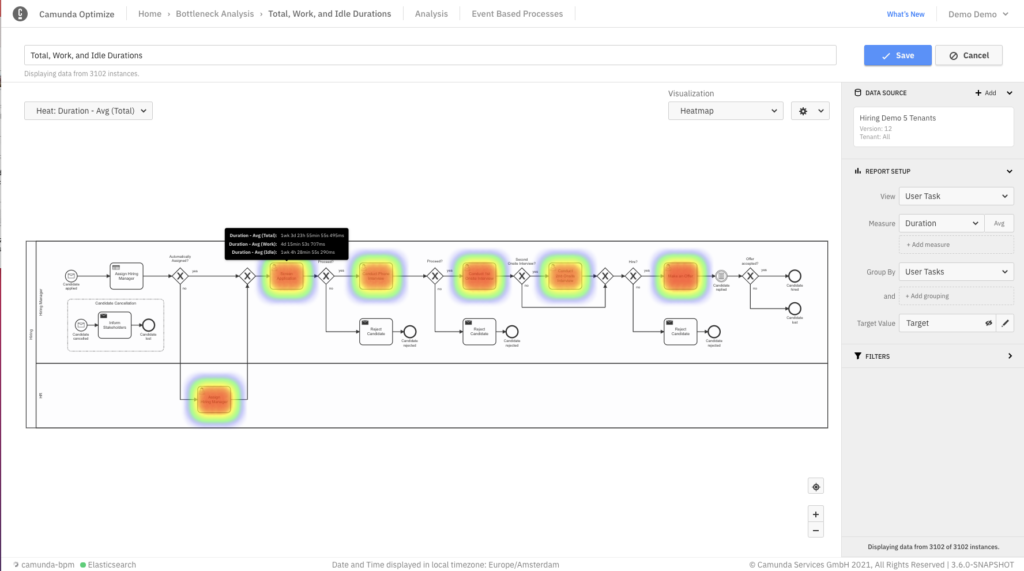
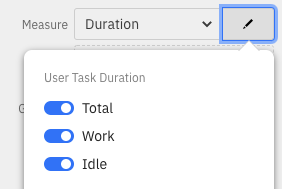
Another way of identifying a bottleneck is by seeing how long a task waits before someone claims it, which will be shown as part of the Total, Work, and Idle Durations heatmap. You can reproduce it by viewing user task total, work and idle duration, grouped by user task with the heatmap visualization. There are two main things you can do with this heatmap:
- If you’re viewing the report, you can toggle the heatmap by showing the total, work and idle durations for a process instance. The heatmap will light up different parts of your process depending on whether tasks are labor-intensive (long “work” duration) or have a longer backlog (long “idle” duration).
- You can set targets. On average, how long do you want your process instances to spend in each status (total, work or idle) in each of these steps? We can revisit this step later.
What is the root cause of my bottleneck?
First, we need to isolate the root cause for our bottleneck.
Many types of constraints could be the root cause. Here are a few examples of each type in a Camunda context.
- Resource – The number of workers able to perform tasks or your Camunda Engine’s capacity
- Practice – Legal or the company requires a manual review of a business process or has a long-held belief in an inefficient process
- Long-Term – Customer demand for your service/product or the business process’s level of automation
Optimize is designed to help you perform quantitative analysis. Specifically, you can evaluate how much performance varies by task assignee or a variable created in the Camunda Engine.
The first step is to explore variation in duration among task assignees. High variance suggests an uncontrolled, unpredictable process. The goal is not to evaluate performance but try to figure out what’s happening so you can standardize best practices.
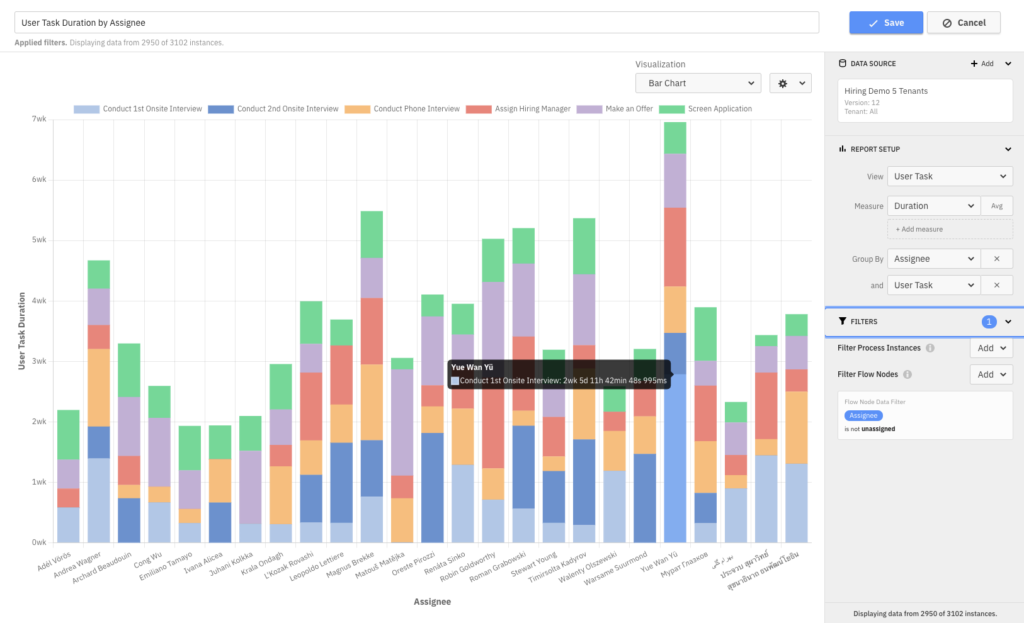
The following graph to view is the User Task Duration by Assignee bar chart, which groups data by user task, filters out any unassigned tasks (we’ve discussed those already), and stacks the bars (see the settings cog for more information).
With a stacked bar chart (new in Optimize 3.6.0), you can see which users work quicker than others and understand the amount of variance in each task. If the bars in the stack are about the same size across the chart, you have a standardized process. However, this example shows a high variation in task duration among different assignees. This information might spark some interview questions to get to the bottom of the issue.
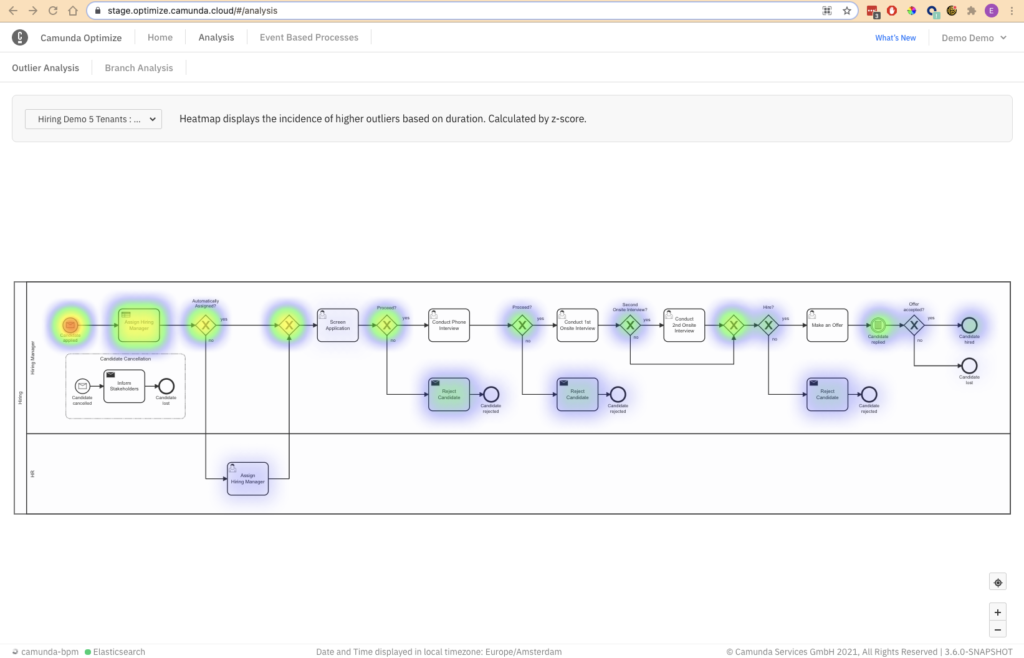
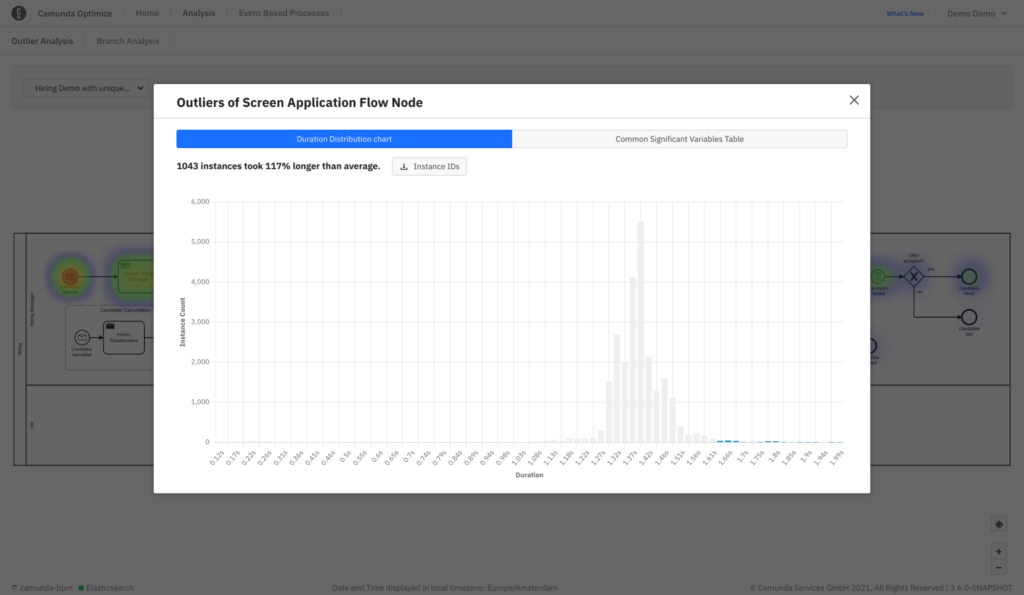
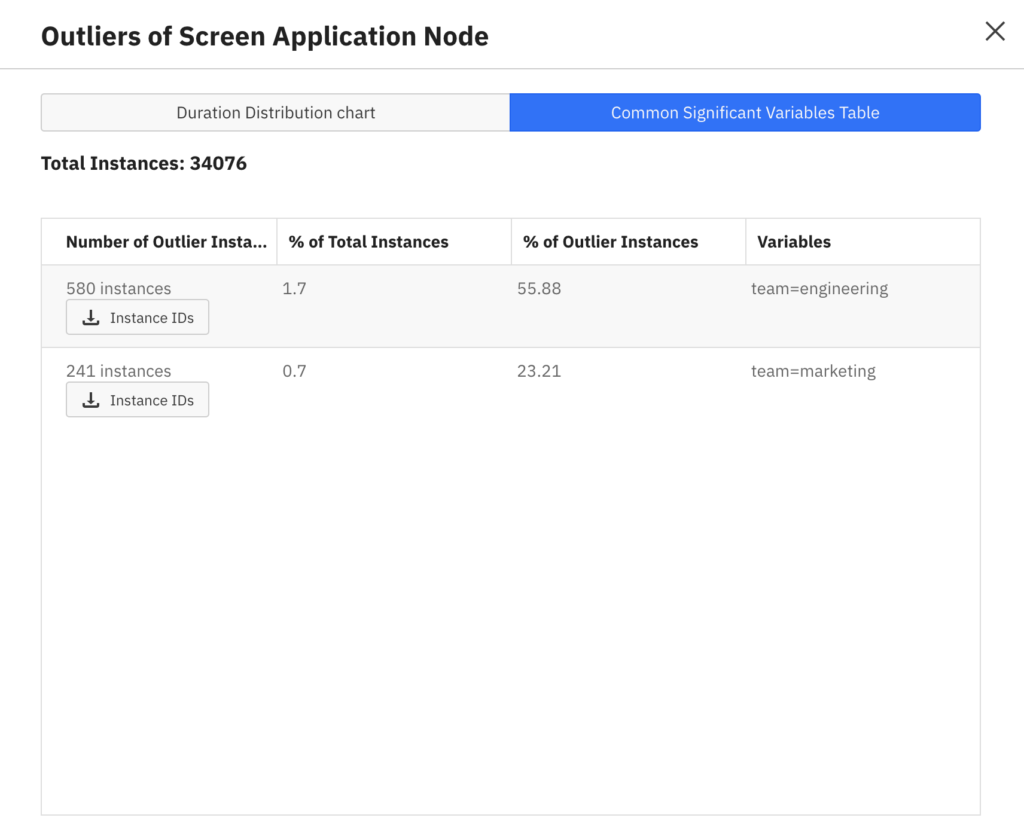
The second step is to evaluate your data for outliers and see if variables are the likely root cause in the Outlier Analysis feature. As you can see in the example, this is a heatmap that lights up the flow-nodes where outlier process instances take an abnormally long time to complete. Clicking into the details of a bright node shows you a distribution of duration and tries to find if the outliers have a shared variable.
Summary
Let’s recap what we just covered here.
Using the Theory of Constraints, you identified your bottleneck’s location and root cause, plus you have the hard data to back it up in a presentable dashboard.
Hold on for Part 2 of this guide, that’ll go into how you can solve your bottleneck and track its progress.
Getting Started
Getting started on Camunda is easy thanks to our robust documentation and tutorials
