Today we announce the release of camunda BPM 7.0.0-alpha6. In this release we focused on visualizing process instance state on top of a rendered diagram in cockpit. We added the following features:
- Process Instance Detail view in cockpit visualizing active activity instances with count
- Updated process definition view to include failed jobs from sub process instances
- Greatly improved Javascript BPMN 2.0 Renderer (now feature complete)
- Added persistent Activity Instance tree in process engine
- Event Subscription Query is exposed in REST and Java API
41 issues were closed. See the complete release notes in Jira.
Process Instance Detail View in Cockpit
In cockpit we started work on the process instance detail view. This view will allow you to drill down into a single process instance and explore it’s running and completed activities as well as the variables, tasks, jobs… associated. To open the process instance detail view, you can select a process definition on the start page (dashboard), navigate the the process definition page and select a process instance from the instance list.
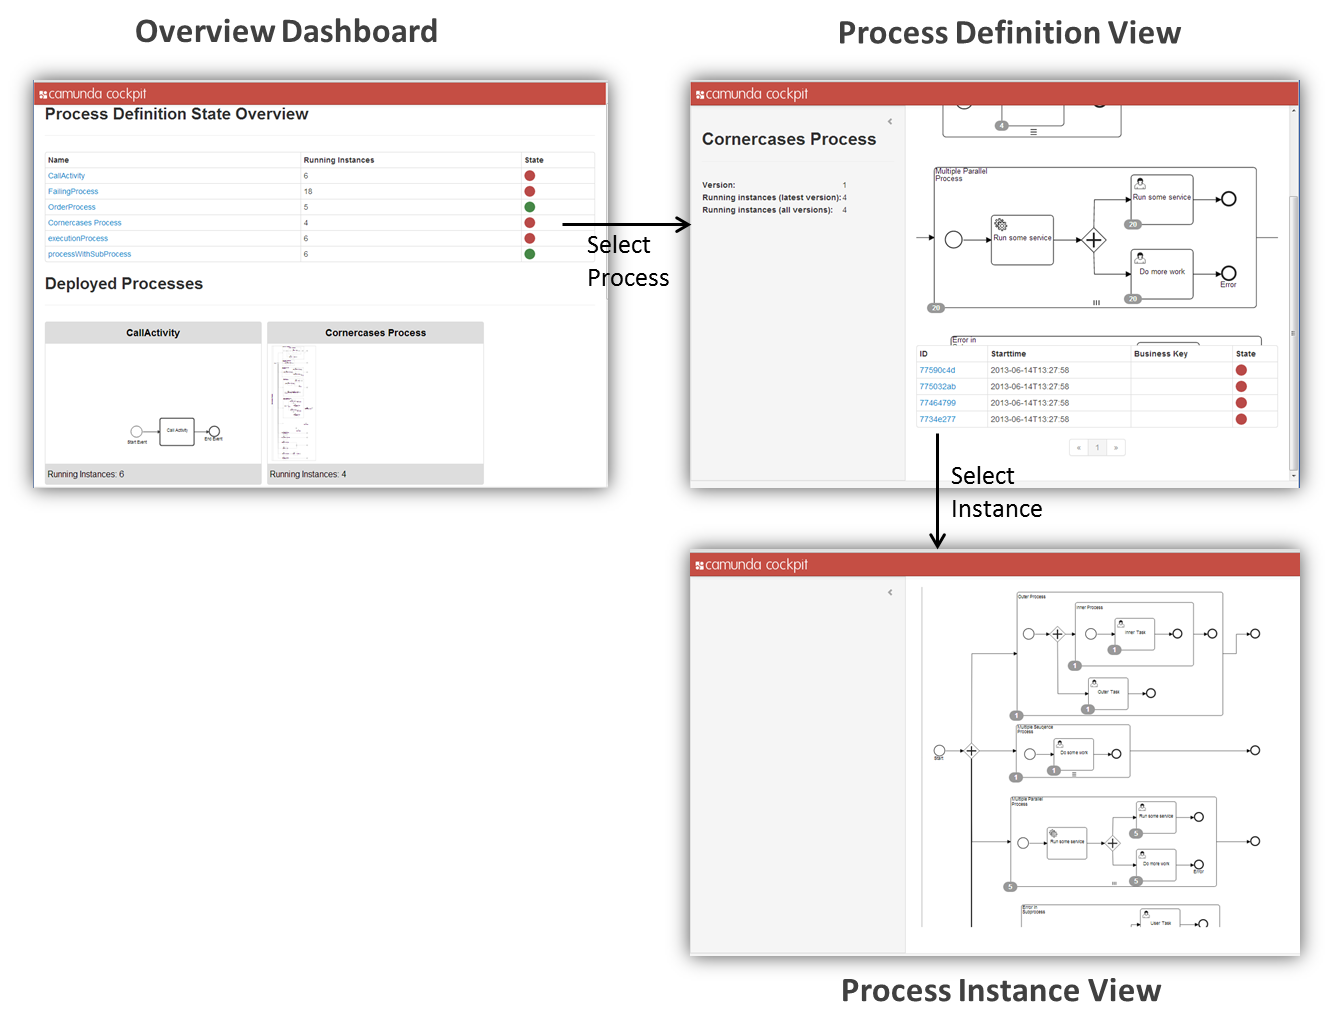
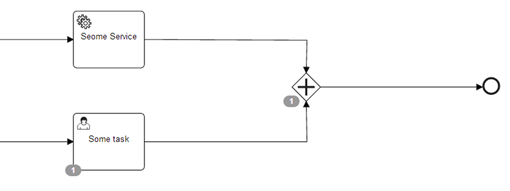
In the initial increment we focused on rendering the process diagram (using our Javascript-based BPMN renderer) and visualizing the currently active activity instances on this diagram:
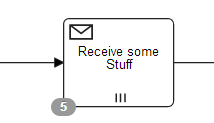
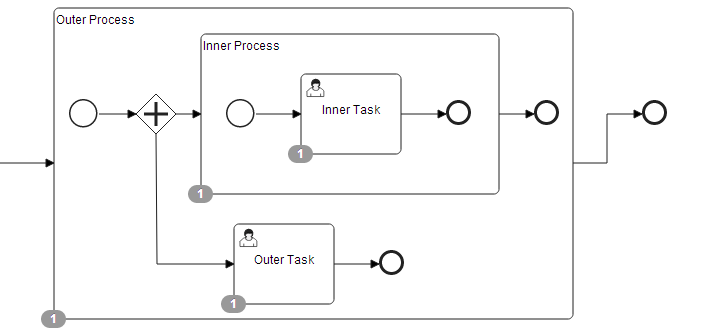
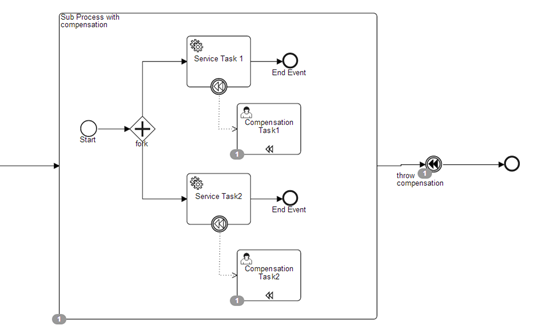
How does it work?
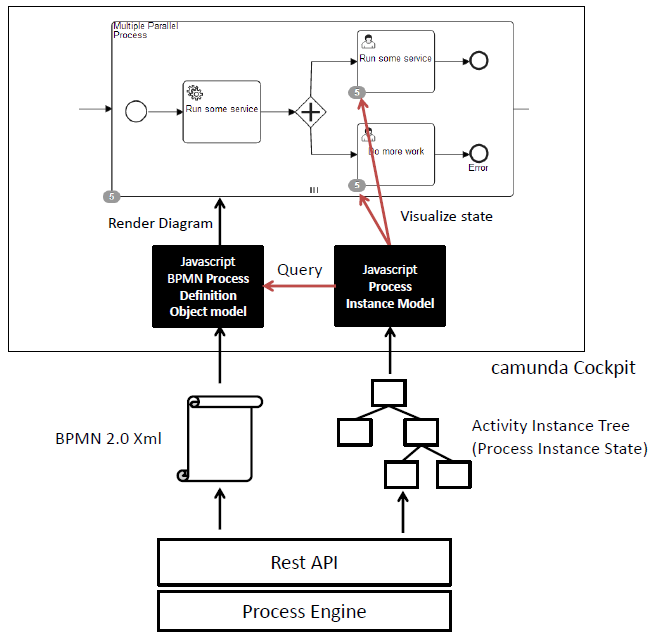
In order to visualize these diagrams, Camunda Cockpit creates two client side models:
- The process definition object model: is a JavaScript object model representation of the parsed BPMN 2.0 process definition XML. The model has the form of a tree structured in accordance with the BPMN 2.0 semantic process model. We merge the BPMN Diagram Interchange information into this tree.
- The process instance object model: is a JavaScript object model representation of the current process instance state. The model has the form of a tree and is constructed from the Activity Instance Tree (new feature) retrieved from the process engine.
Both the process definition tree and the process instance tree have the same structure (ie. activity instances in the process instance tree are at the same level as their corresponding activity definitions in the object model.). In order to achieve this, we had to make a couple of additions in the core process engine (PVM-Process Virtual Machine).
Visualizing the Activity Instance Tree
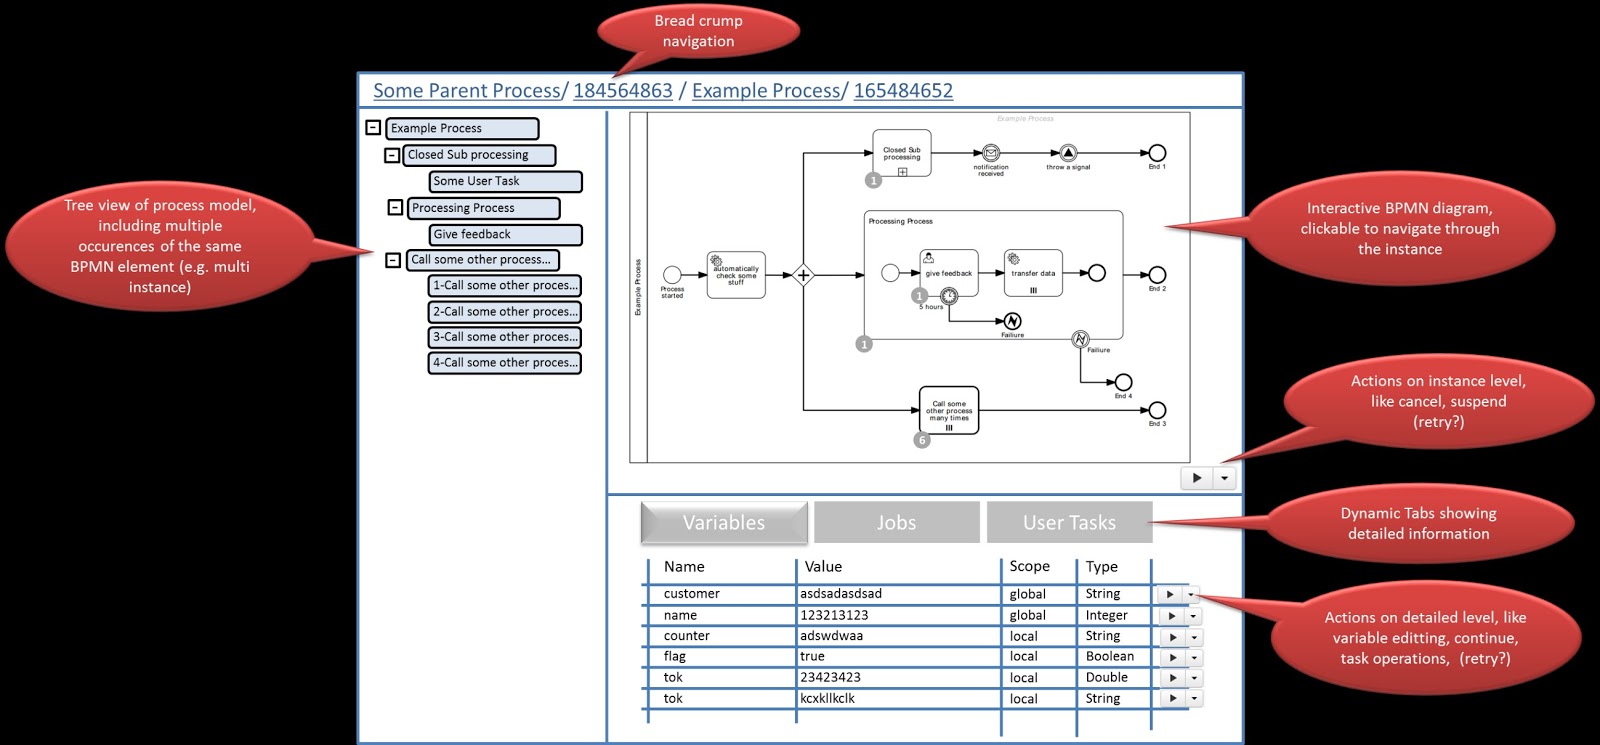
We will visualize the Activity Instance tree in the process instance detail view on the left hand side:
See CAM-719
