Some Numbers
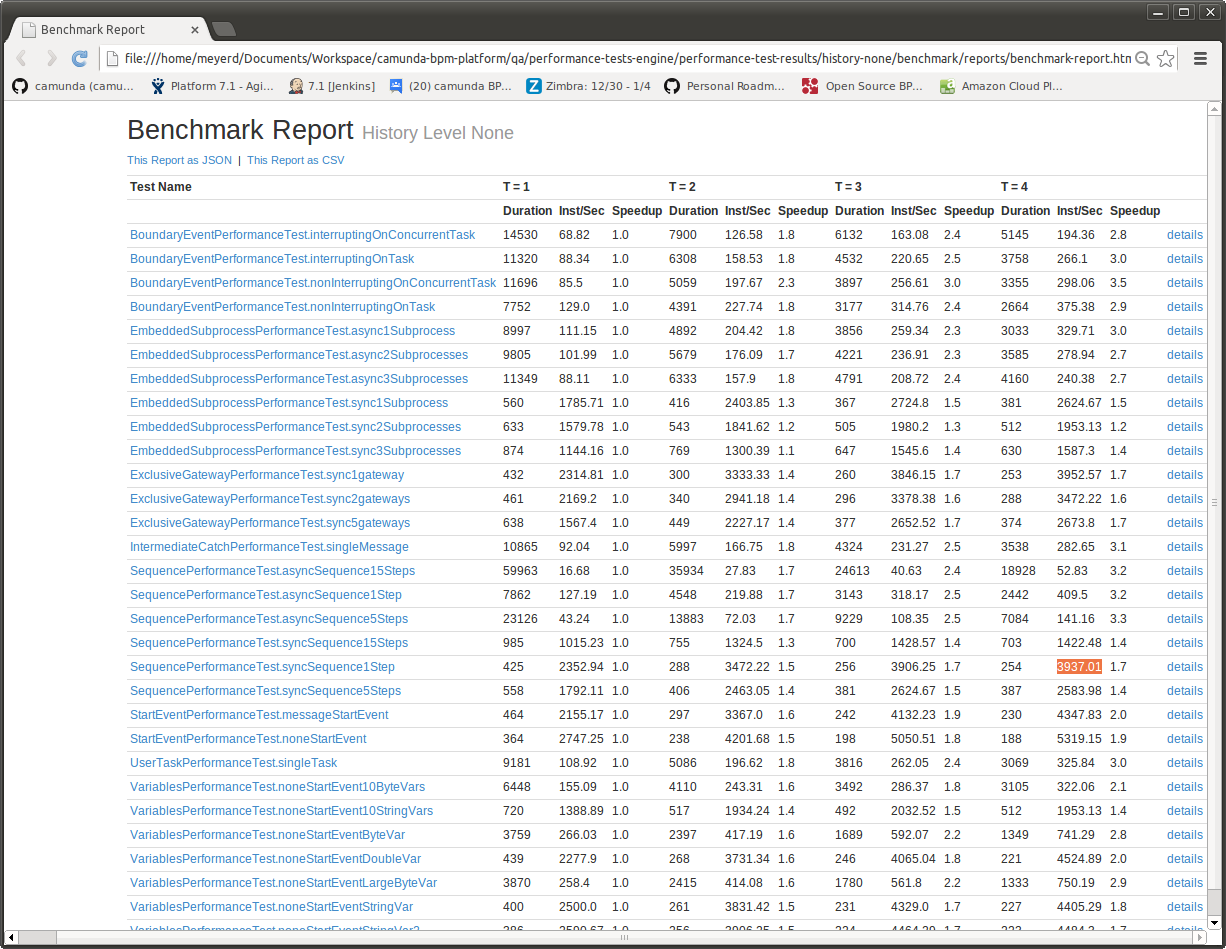
We ran the benchmarks with History Logging turned on and off. Obviously turning History off will improve performance dramatically 🙂
Download the test results here. (Contains many more processes than shown here).
You can also have a look at the testsuite itself.
Numbers are PostgreSQL with stock memory configuration on the hardware described at the end of the post.
History vs. No History
If you look at a simple process which consists of a sequence with a single (no-op) step:
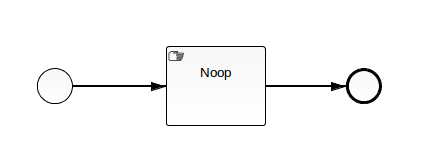
Without History, we get the following results:
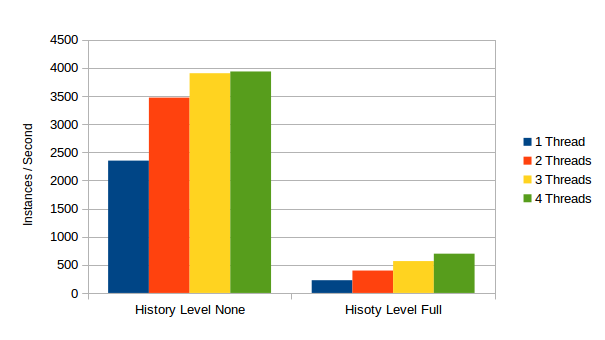
Without history, we can execute up to 3937.01 Instances of this process per second using 4 Threads. This means that executing a single instance of this takes 0,2 Milliseconds. So not even a whole millisecond! As amazing as this sounds, there must be a trick involved 🙂 And there is: The “trick” behind this number becomes clear if we look at the the Sql Statement log:

At History Level None, this process does not perform any inserts to the database, it will just perform a single SELECT. Since this process does not have any waitstate, it will just complete in a single transaction and we do not have to write off any execution state. If we dive into the details, we see that we just select the last version of the process definition:
{
  "testName" : "SequencePerformanceTest.syncSequence1Step",
  "configuration" : {
    "testWatchers" : "org.camunda.bpm.qa.performance.engine.sqlstatementlog.StatementLogPerfTestWatcher",
    "historyLevel" : "none"
  },
  "passResults" : [ {
    "duration" : 7,
    "numberOfThreads" : 1,
    "stepResults" : [ {
      "stepName" : "StartProcessInstanceStep",
      "resultData" : [ {
        "statementType" : "SELECT_MAP",
        "statement" : "selectLatestProcessDefinitionByKey",
        "durationMs" : 5
      } ]
    } ]
  } ]
}
Given that we run this select over and over in the benchmark, I assume that the database will put this result into some sort of in-memory cache and will not actually hit the Disk a lot. Hence the results. Turning on history obviously has a dramatic performance impact. At history level “FULL” we can still run up to 698.32 instances of this process per second, boiling down to a single instance taking about 1,43… Milliseconds. Which is still good. Looking at the Sql Statement Log explains the difference:
{
  "testName" : "SequencePerformanceTest.syncSequence1Step",
  "configuration" : {
    "testWatchers" : "org.camunda.bpm.qa.performance.engine.sqlstatementlog.StatementLogPerfTestWatcher",
    "historyLevel" : "full"
  },
  "passResults" : [ {
    "duration" : 7,
    "numberOfThreads" : 1,
    "stepResults" : [ {
      "stepName" : "StartProcessInstanceStep",
      "resultData" : [ {
        "statementType" : "SELECT_MAP",
        "statement" : "selectLatestProcessDefinitionByKey",
        "durationMs" : 1
      }, {
        "statementType" : "INSERT",
        "statement" : "insertHistoricProcessInstanceEvent",
        "durationMs" : 1
      }, {
        "statementType" : "INSERT",
        "statement" : "insertHistoricActivityInstanceEvent",
        "durationMs" : 1
      }, {
        "statementType" : "INSERT",
        "statement" : "insertHistoricActivityInstanceEvent",
        "durationMs" : 0
      }, {
        "statementType" : "INSERT",
        "statement" : "insertHistoricActivityInstanceEvent",
        "durationMs" : 0
      } ]
    } ]
  } ]
}
On top of the select, we now need to perform 4 INSERTs, logging the Historic Activity Instances to the Database.
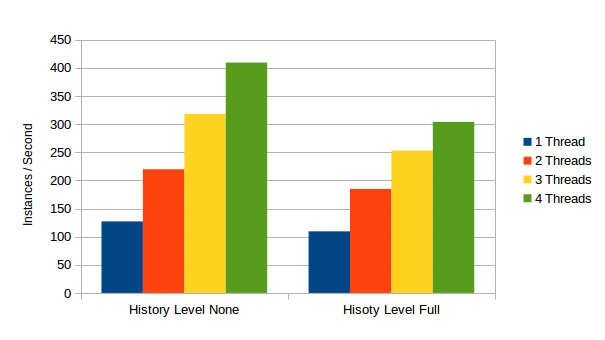
Wait States
{
  "testName" : "SequencePerformanceTest.asyncSequence1Step",
  "configuration" : {
    "testWatchers" : "org.camunda.bpm.qa.performance.engine.sqlstatementlog.StatementLogPerfTestWatcher",
    "historyLevel" : "none"
  },
  "passResults" : [ {
    "duration" : 5,
    "numberOfThreads" : 1,
    "stepResults" : [ {
      "stepName" : "StartProcessInstanceStep",
      "resultData" : [ {
        "statementType" : "SELECT_MAP",
        "statement" : "selectLatestProcessDefinitionByKey",
        "durationMs" : 0
      }, {
        "statementType" : "INSERT",
        "statement" : "insertExecution",
        "durationMs" : 1
      } ]
    }, {
      "stepName" : "SignalExecutionStep",
      "resultData" : [ {
        "statementType" : "SELECT_MAP",
        "statement" : "selectExecution",
        "durationMs" : 1
      }, {
        "statementType" : "SELECT_MAP",
        "statement" : "selectProcessDefinitionById",
        "durationMs" : 0
      }, {
        "statementType" : "SELECT_LIST",
        "statement" : "selectVariablesByExecutionId",
        "durationMs" : 0
      }, {
        "statementType" : "SELECT_LIST",
        "statement" : "selectExecutionsByParentExecutionId",
        "durationMs" : 1
      }, {
        "statementType" : "DELETE",
        "statement" : "deleteExecution",
        "durationMs" : 0
      } ]
    } ]
  } ]
}
In History, the historic Activity Instance needs to be INSERTED when the execution firsts enters the activity and then UPDATED (with an END timestamp + maked completed) when it is ended. In order for this update to be efficient, it is important that the existing Historic Activity Instance row can be located efficiently.
What we did last Summer: Optimizing History for Waitstates
This brings me to something we made a lot of progress on when working on camunda BPM 7.0 Final: Having proper activity instance Ids in Runtime allows us to update history efficiently. A side effect of the changes described in this blogpost was that we could highly optimize the update of open Historic Activity Instances in History: If you know the unique Id of an Activity Instance in Runtime and use that as primary key for the historic activity instance table in History, then you can do updates using the primary key. Which is way more efficient than the complex search query we did in the past. Back in summer we benchmarked this with a process containing 15 wait states:
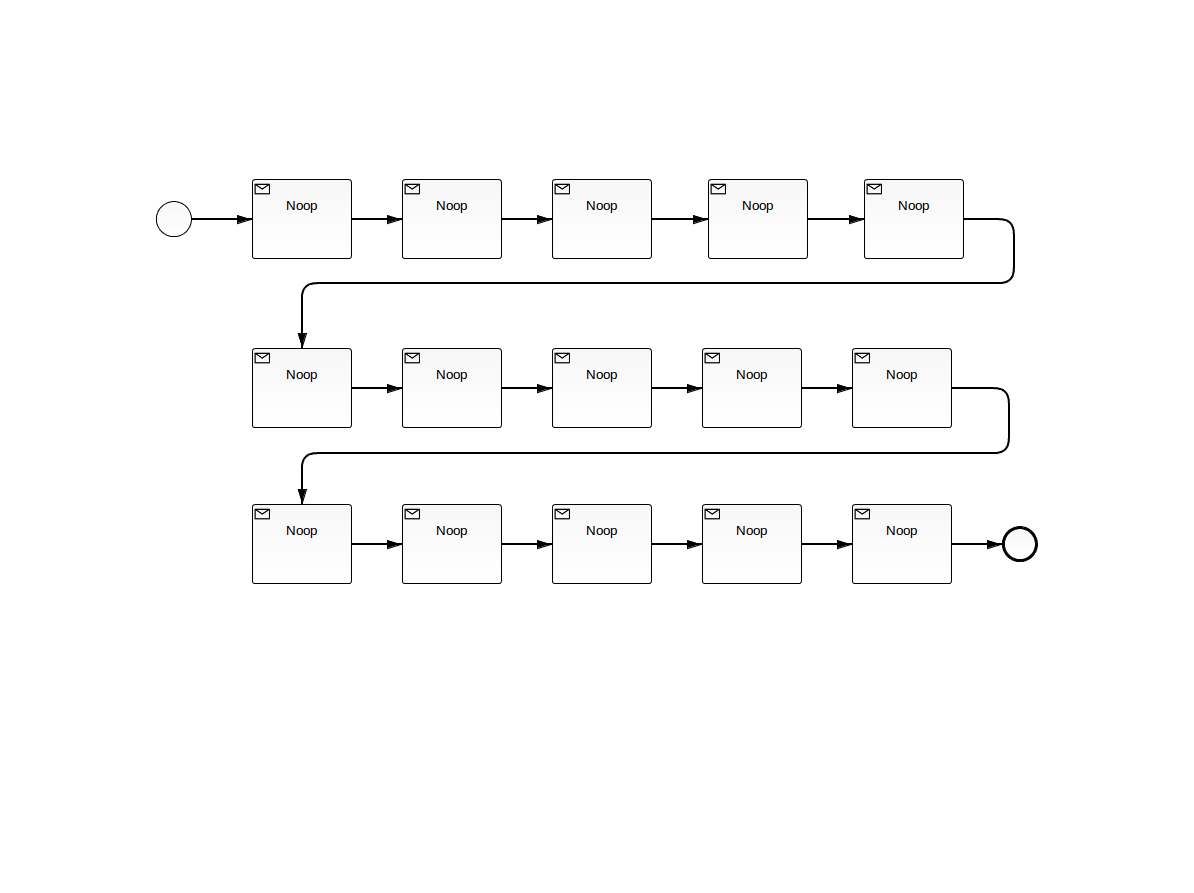
We ran the benchmark in a way that we continuously had 200,000 running process instances and looked at how many we could complete while starting new ones:
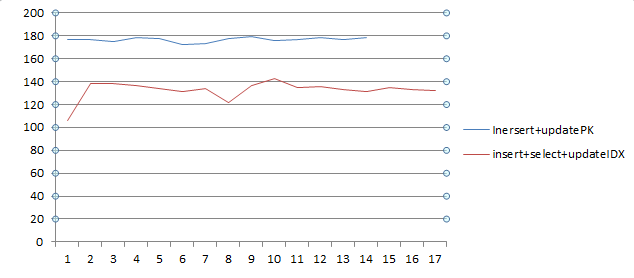
The blue line is the new implementation doing an update by primary key, the red line is the old implementation which needs to do a complex search on the table for the correct Historic Activity Instance. As you can see the optimization brings up to 40 more completed instances per second. What’s more we could get rid of a large composite table index which took up more space than the actual data inside the table (after 5 million activity instances, the table size was ~1820MB, the Index size was ~3975MB, PostgreSQL) .
Another thing which is now possible is asynchronous history logging using a messaging system. I am REALLY looking forward to benchmarking that configuration.
Process Variables
A third major performance impact is process variables. Up until now we have only looked at process engine only state. But when implementing interesting processes, you usually want to move some data 🙂
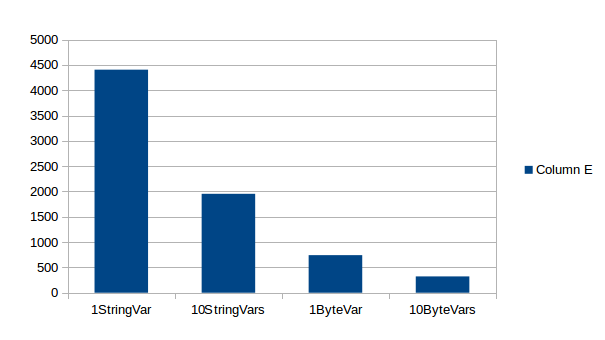
We included some simple process variable tests in the testsuite. The following charts shows how adding more process variables impacts throughput:
{
  "testName" : "VariablesPerformanceTest.noneStartEvent10StringVars",
  "configuration" : {
    "numberOfThreads" : 1,
    "numberOfRuns" : 1,
    "databaseName" : "org.h2.Driver",
    "testWatchers" : "org.camunda.bpm.qa.performance.engine.sqlstatementlog.StatementLogPerfTestWatcher",
    "historyLevel" : "full"
  },
  "passResults" : [ {
    "duration" : 26,
    "numberOfThreads" : 1,
    "stepResults" : [ {
      "stepName" : "StartProcessInstanceStep",
      "resultData" : [ {
        "statementType" : "SELECT_MAP",
        "statement" : "selectLatestProcessDefinitionByKey",
        "durationMs" : 2
      }, {
        "statementType" : "INSERT",
        "statement" : "insertHistoricProcessInstanceEvent",
        "durationMs" : 1
      }, {
        "statementType" : "INSERT",
        "statement" : "insertHistoricActivityInstanceEvent",
        "durationMs" : 2
      }, {
        "statementType" : "INSERT",
        "statement" : "insertHistoricVariableUpdateEvent",
        "durationMs" : 1
      }, {
        "statementType" : "INSERT",
        "statement" : "insertHistoricVariableInstance",
        "durationMs" : 1
      }, {
        "statementType" : "INSERT",
        "statement" : "insertHistoricVariableUpdateEvent",
        "durationMs" : 1
      }, ... ]
    } ]
  } ]
}
Byte variables are worse: In that case both a variable instance and a Byte array entity must be inserted.
How I discovered that my SSD is broken
The Hardware we ended up running the Benchmark on
But luckily, Sebastian stepped in and offered to run the benchmarks on his box. He uses a Lenovo Thinkpad and runs Archlinux.
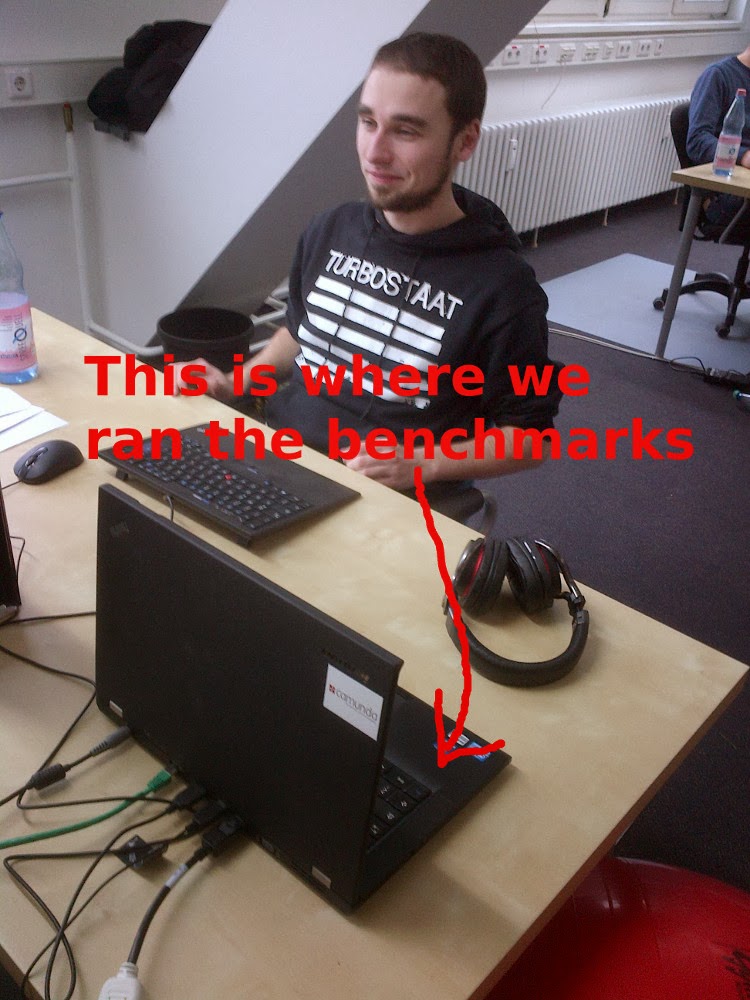
Sebastian running the Benchmarks on his developer Box:
Intel Core i5 (4 Cores, 2.5 Ghz)
SSD Hard Disk,
8Gig Main Memory
Archlinux Kernel 3.12.8
Now you are probably thinking: What!?!?… some guy running a benchmark on his developer box while hacking away, writing email and wearing a dubious underground style hoodie… Are you kidding me? Am I supposed to take this seriously?
I say: Yes you should! Here is why:
a) We are not interested in absolute numbers anyway: As I explained yesterday, our goal with this performance testsuite is not to produce absolute numbers. We know from extensive customer interaction and own benchmarks that the process engine is fast. Just how fast exactly depends on a number of factors we cannot easily reproduce here anyway. So we may as well go ahead and run it on developer box. (The perspective is to integrate the performance testsuite into CI – yes we do have actual high performance pizza-box servers for that – and systematically track performance over time: see last paragraph of this post.)
b) The playing-around-while-wearing-the-underground-hoodie-numbers are impressive enough, I think. Anything else can only be better 😉
The Perspective
Getting Started
Getting started on Camunda is easy thanks to our robust documentation and tutorials
