Note: The specific performance metrics in this blog post are from an earlier release of Zeebe. Since this post was published, work has been done to stabilise Zeebe clusters, and this has changed the performance envelope. You can follow the steps in this blog post to test the current release of Zeebe yourself, and derive the current performance envelope.
Zeebe advertises itself as being a “horizontally-scalable workflow engine”. In this post, we cover what that means and how to measure it.
What is horizontal scalability?
(In case you are familiar with the basic concept of horizontal scalability, you can just skip this section.)
Scalability is an answer to the question, “How can I can get my system to process a bigger workload?”
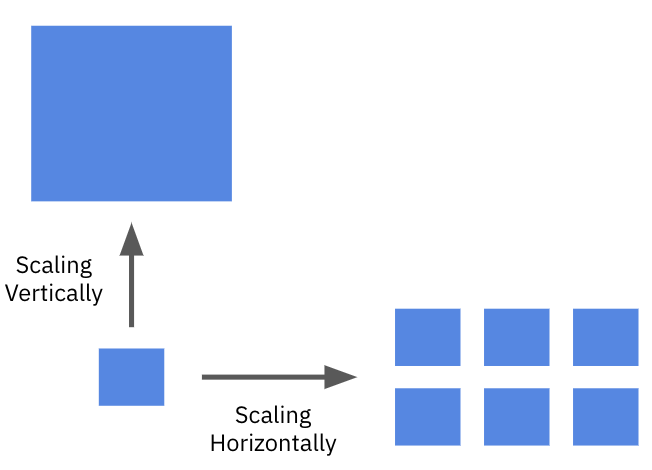
In general, there are two approaches to scalability:
- Scaling the system vertically by beefing up the machine that runs the system by adding more processing power (CPU, memory, disk, …)
- Scaling the system horizontally by using more (usually smaller) machines that run as a cluster

A system is said to be horizontally scalable if adding more machines to the cluster yields a proportional increase in throughput.
The test setup
Zeebe is designed to be a horizontally scalable system. In the following sections, we’ll show you how to measure that.
In our test, we run the infrastructure on Google Kubernetes Engine (GKE) in Google Cloud:

There are three components:
- Load generator: a Java program that embeds the Zeebe client and simply starts workflow instances
- Zeebe cluster: a cluster of Zeebe brokers which we scale to different sizes to understand the relationship between cluster size and performance
- Monitoring infrastructure: while the test is running, Prometheus is used to collect metrics from the Zeebe cluster and expose them via a dashboard in Grafana
The workload
In the test, we deploy a simple BPMN process that has a start event, service task and and end event.

The Load Generator then starts workflow instances by executing the following command:
zeebe.newCreateInstanceCommand()
  .bpmnProcessId("benchmark-process")
  .latestVersion()
  .send();
Resources assigned to the brokers
The Zeebe brokers are defined as a stateful set in Kubernetes. We assign:
- 16 GB of ram
- 500 GB of SSD storage
- 7 CPU cores
The results
To measure horizontal scalability, we test using the same workload while gradually increasing the number of brokers and partitions:
| Brokers | Partitions | Workflow instances started/second (AVG) |
|---|---|---|
| 1 | 8 | 1300 |
| 3 | 24 | 3600 |
| 6 | 48 | 5200 |
| 12 | 96 | 8200 |
| 24 | 192 | 14000 |
The following chart shows that Zeebe currently exhibits a nice linear scalability behavior. As we add more brokers, we observe a proportional increase in throughput, as visualized in the following chart:

The following is a screenshot from Grafana which shows the individual test runs:

Conclusion
This post is just a quick overview of what horizontal scalability in Zeebe means. Please note that even though Zeebe is now available as a production ready release, it is still at a stage where it has a lot of potential for performance optimization. We expect “per broker” performance to improve over time, and this is certainly a topic we’ll invest in on an ongoing basis.
“Workflow instances started per second” is just one of many performance metrics that are important to users–this certainly wasn’t a comprehensive look at Zeebe’s performance characteristics. And as is the case with any benchmark blog post, this provides just one “point in time” snapshot measuring performance of a particular version of Zeebe.
The main takeaway, and what we wanted to demonstrate here, is that we can already see that the system can scale linearly as expected when adding more brokers. Which is awesome!
When it comes to performance, we’re always curious to hear what users are seeing, too, so feel free to let us know if you have any feedback via either of the channels below.
Have a question about Zeebe? Drop by the Slack channel or Zeebe user forum.
