We’re excited to announce the release of Camunda Optimize 3.1.
Camunda Optimize provides business activity monitoring for workflows, supporting continuous process improvement by providing transparency into your automated workflows and decisions. Business-friendly reports, dashboards, and alerts make it possible to identify process bottlenecks and improve end-to-end processes.
If you’d like to get started with Optimize 3.1 right away, you can download the release here with your Camunda Enterprise Platform customer credentials.
You can also use Docker to run Camunda Optimize.
And if you’re not yet a Camunda customer, you can sign up here for a free 30-day trial of the Camunda Enterprise Platform, which includes Camunda Optimize.
In the rest of this post, we’ll highlight some of the new capabilities introduced in Optimize 3.1.
Faster Process Insights and Increased Flexibility
With this release we are adding improvements that allow faster process insights so that you are able to set up monitoring and reporting for all your processes quickly and efficiently, and at the same time, offer more flexibility.
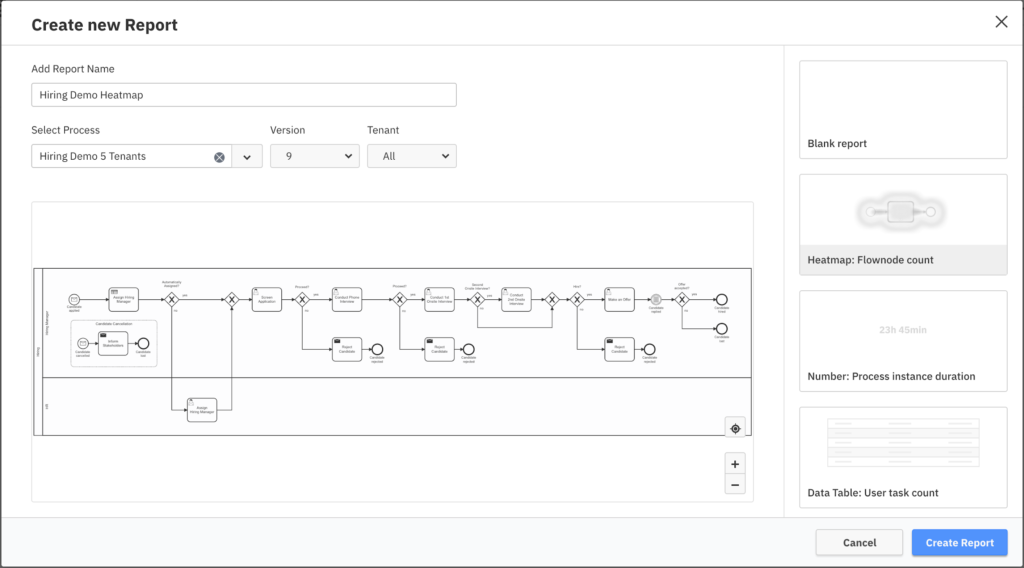
Report Templates
With Optimize 3.1 it is now possible to create reports within seconds. When creating process reports you can choose from most commonly used reports as templates for your process – or alternatively start with a blank report:
Dashboard Filters
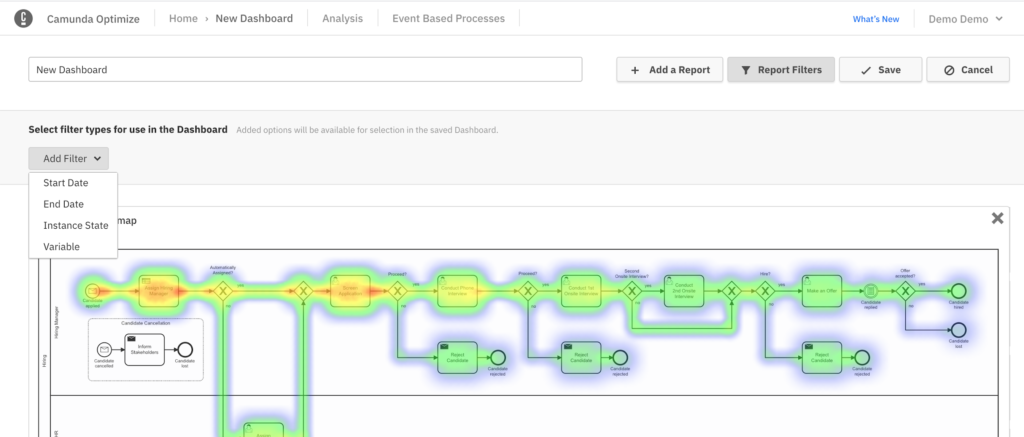
In Optimize users can add one or multiple reports to Dashboards to get an up-to-date view of process performance at a glance. With this release we made Dashboards even more powerful and flexible by introducing Dashboard Filters.
Dashboard Filters allow Dashboard Viewers to apply certain filters across all reports that have been added to a particular Dashboard:
- Editors can choose between a range of different filters and add them to their Dashboard as needed.
- Viewers can easily make use of them on the Dashboard without having to open and edit every single report.
We added Dashboard Filters for Process Instance State, Start / End Date as well as Variable Filters. In the following you can see how Dashboard Editors can add the filters to a Dashboard:
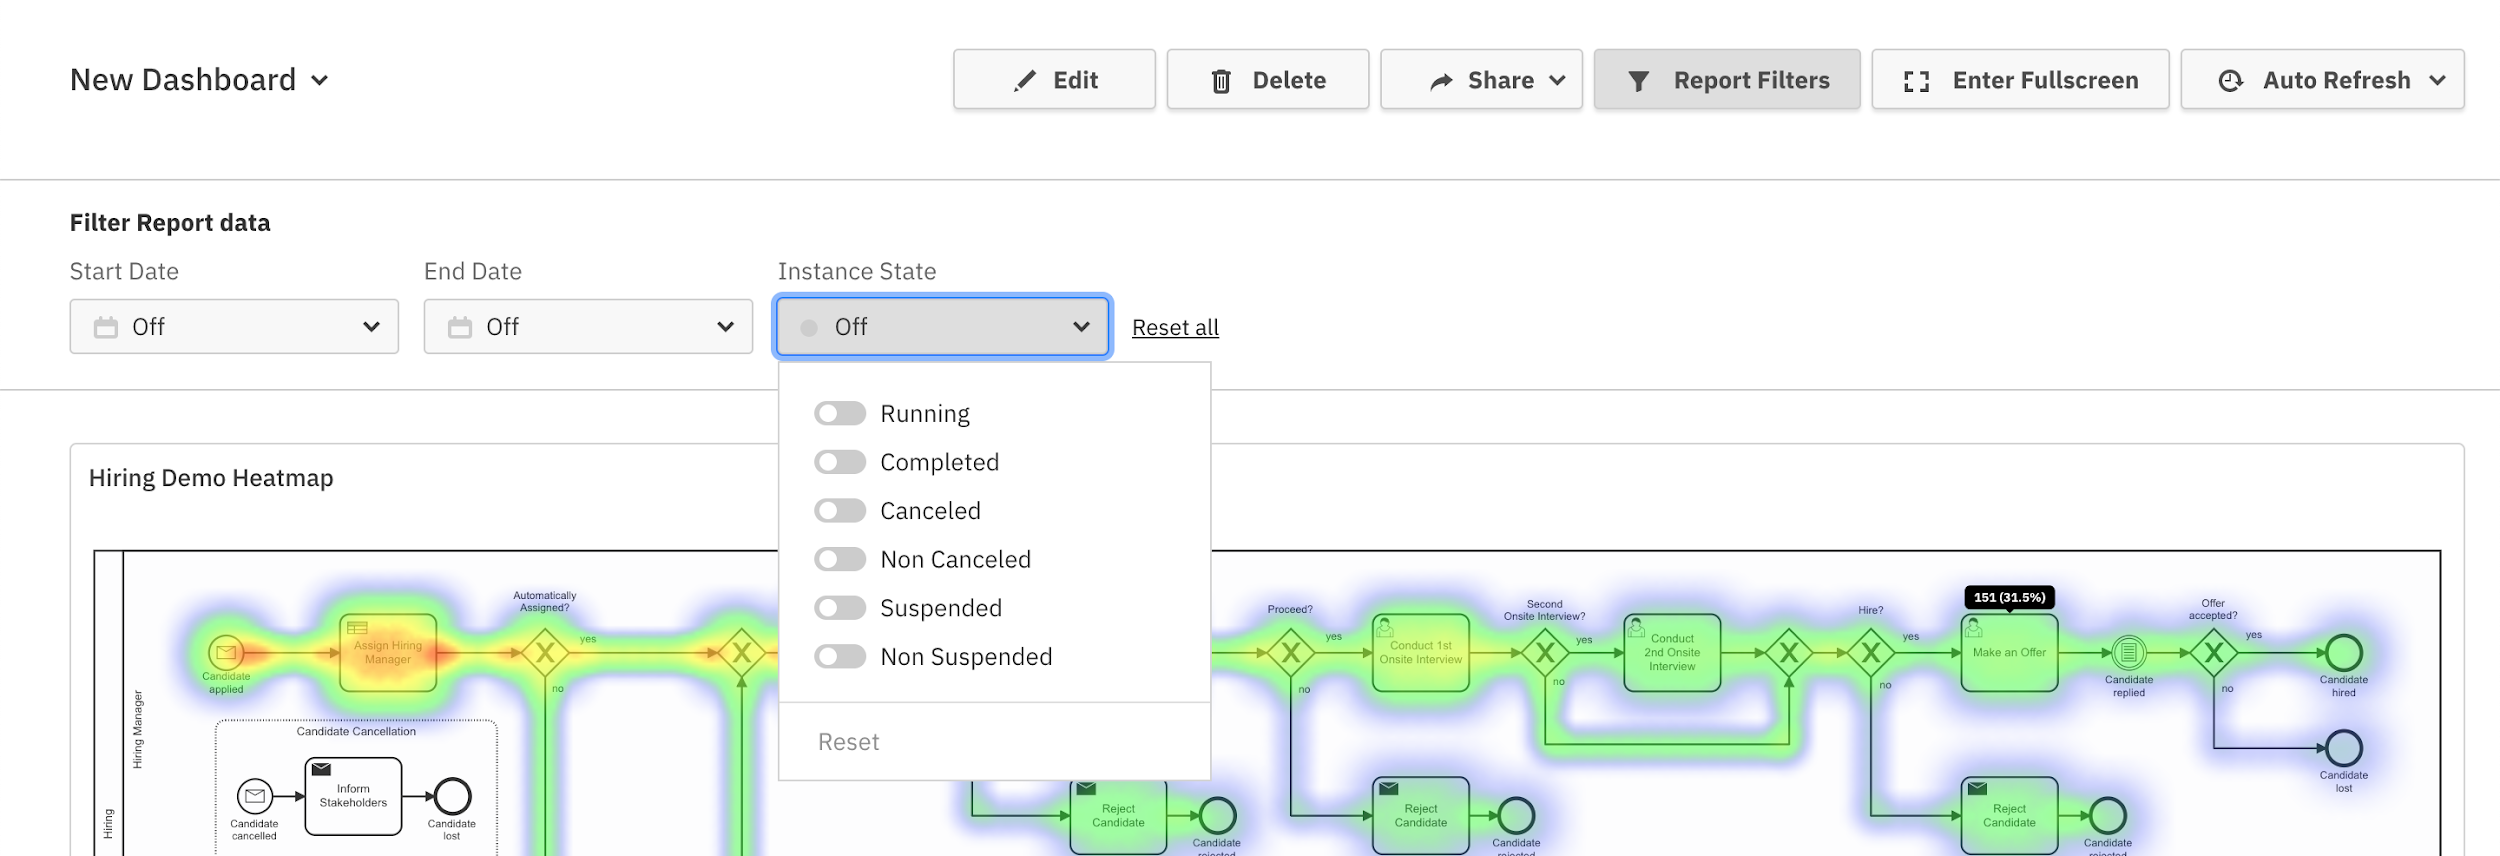
State Filters
Once applied, the state filter can be used by a Dashboard viewer like this:
Start and End Date Filters
Similar to the state filter the start and end date filters can be used like this:

Variable Filters
Variable filters can be used like this:

Report Configuration, Process and Raw Data Access
Besides Report Templates and Dashboard Filters, with this release we improve access to underlying data and report configuration, as well as applied filters.
In the Dashboard View Mode we added the ability to inspect report configuration:
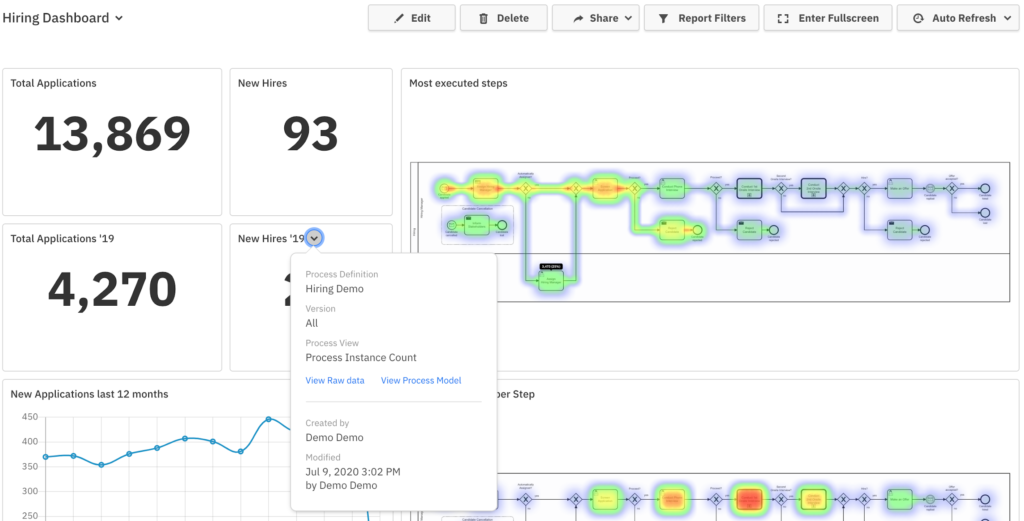
Additionally, we also allow Dashboard viewers to inspect applied filters on a given report:
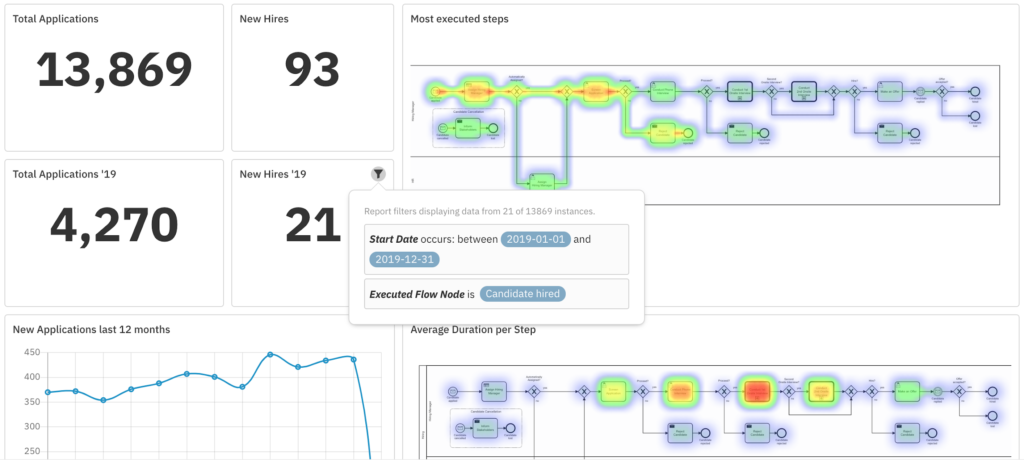
This information is extremely valuable for your Dashboard Viewers to understand what process data is actually being used and what filters are being applied.
Besides just displaying this useful information, the new overlay additionally allows users to quickly access the underlying process instances as raw data, as well as the underlying Process Diagrams or Decision Tables:
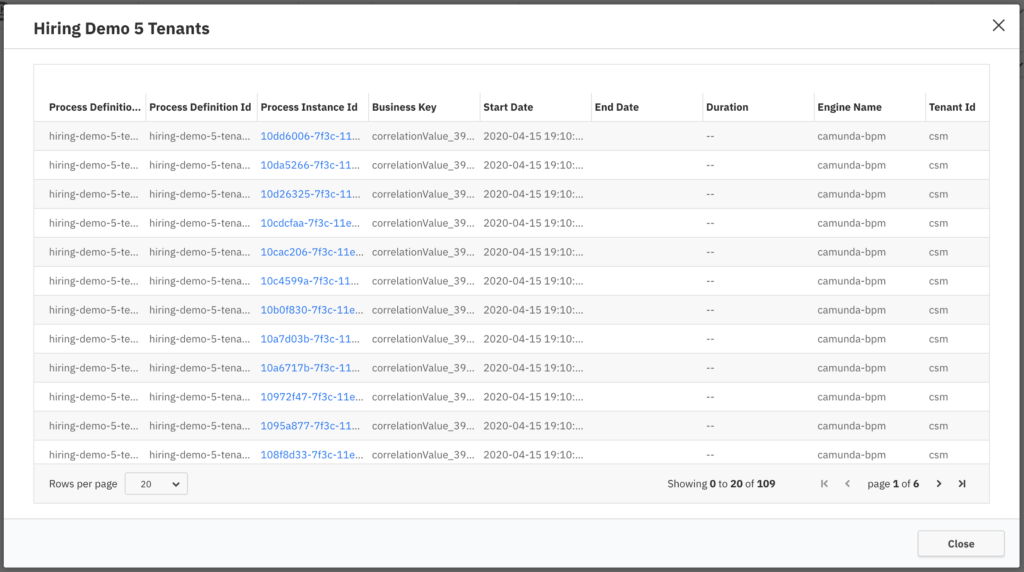
The links to process instances and the underlying data source are only displayed when users are logged in.
Deeper Process Insights
Besides allowing quicker process insights, with Optimize 3.1 we added a new view to the report builder, added new filters and improved existing ones to allow for even deeper process insights.
Variable Reports
Most processes make use of business data that is relevant for the process and also business performance. Camunda BPM Runtime automatically stores these variables and therefore Optimize can make use of them efficiently.
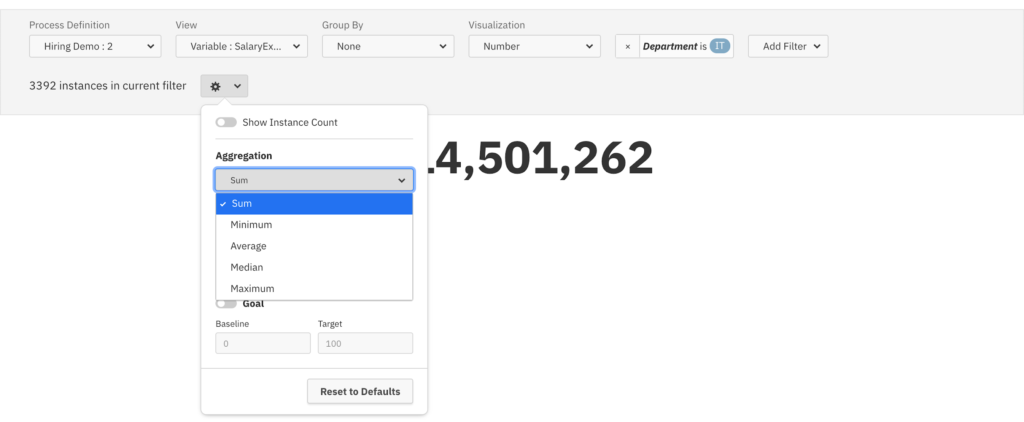
With this release we are improving the support of Process Variables by adding a new View “Variables” to the report builder. This allows you to set up reports solely focusing on variable values of selected process instances. Monitoring process variables (over time or depending on context) can bring you strong insights for process improvement. As an example, in the below report you can see how we can compare Salary Expectations of Applicants across different teams based on our Hiring Process.

Powerful Flow Node and User Task Filters
Flow Node and User Task Duration Filter
Flow Node and User Task Duration are a great indication for underperformance or bottlenecks within your end-to-end process. Optimize already allows you to look at minimum, maximum and average durations of Flow Nodes and User Tasks for a long time, but with this release we add filtering capabilities for Flow Node and User Task Durations for the first time.
With the help of this new filter you can simply identify process instances where a certain flow node is taking longer or shorter than you expected.
You can find the new Flow Node Duration Filter in the report edit mode alongside the Process Instance Duration Filter under the category Duration.
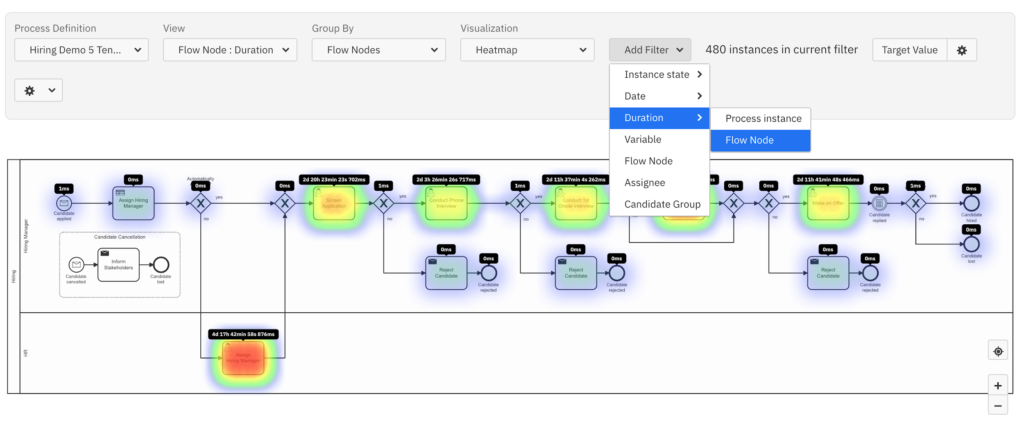
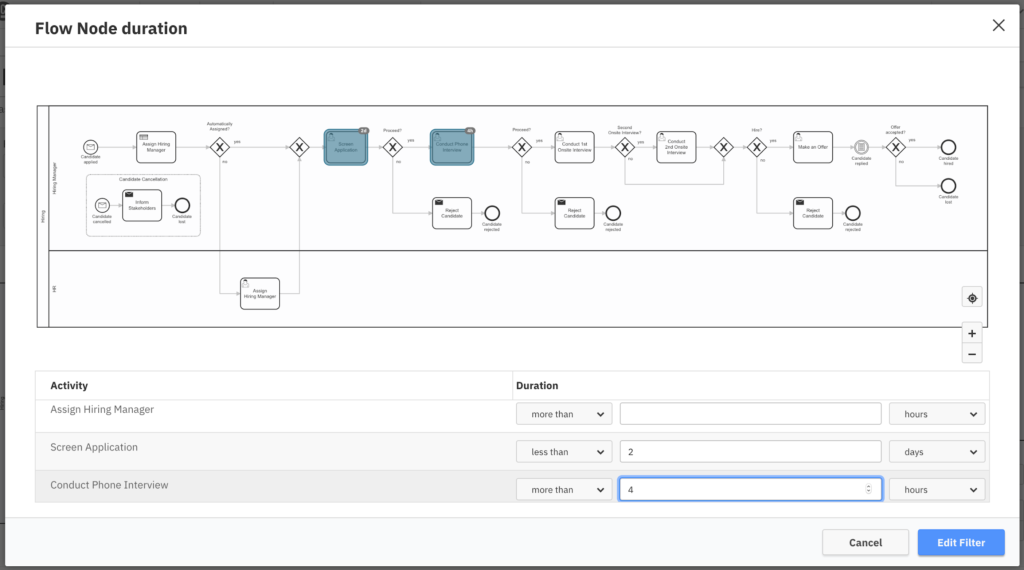
Within the modal you are able to specify a duration for one or multiple flow nodes at the same time (combined with OR).
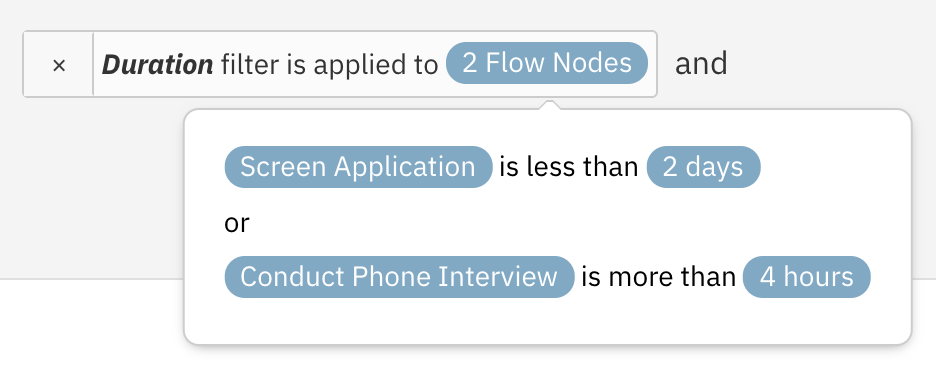
In the report edit mode you are able to see the applied filters with the help of a small overlay:
Assignee and Candidate Group Filter
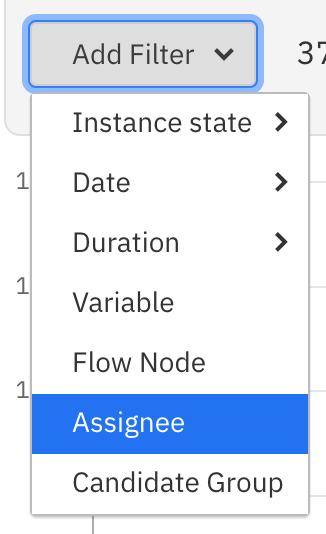
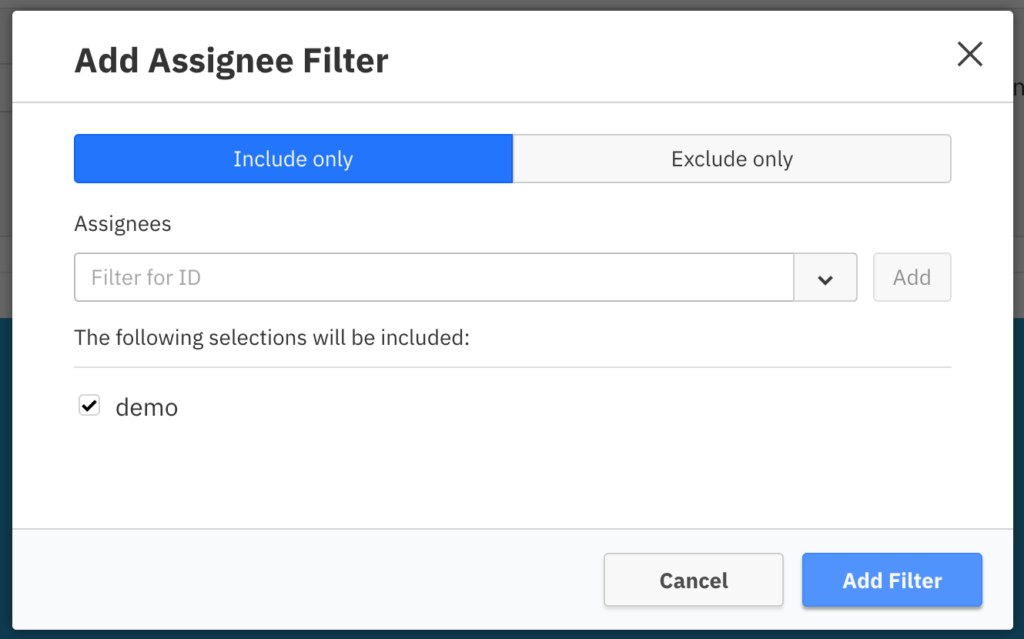
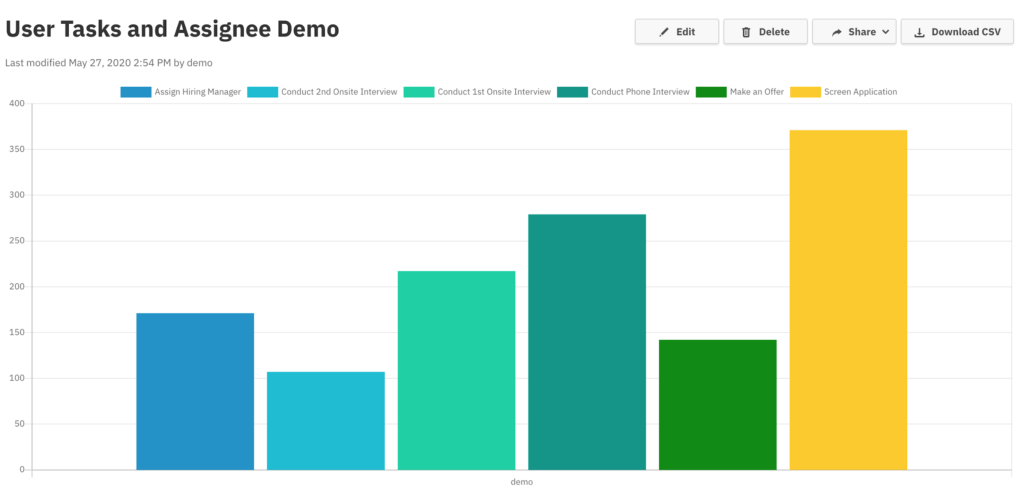
When monitoring performance and execution of User Tasks, assignees and candidate groups are an important ingredient. In order to make the analysis and monitoring more efficient we added Assignee and Candidate Group filters within this release.
You will find the new Assignee and Candidate Group Filters within the report builder filter menu:
Within the modal you can define which assignees (or candidate groups) should be included in the set of process instances you are looking at:
Variable Filter Improvements
Since process context is a very important part of monitoring and process improvement, we extended our variable filters with this release.
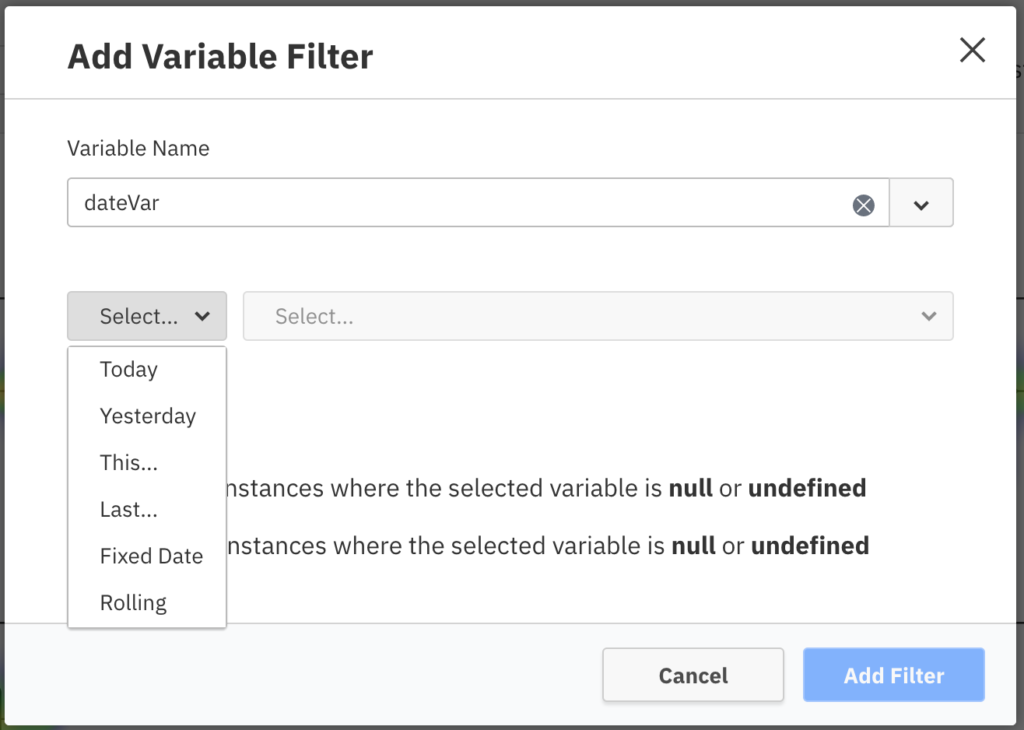
New Date Filters for all Date Variables
In Optimize 3.0 we added new rolling date filters for Process Instance Start Date and End Date Filter. With this release we make these new filters available for all Date Variables so that you can set rolling values such as “Today”, “This week” or “In the past 5 months”.
Improved filtering on null or undefined variable values
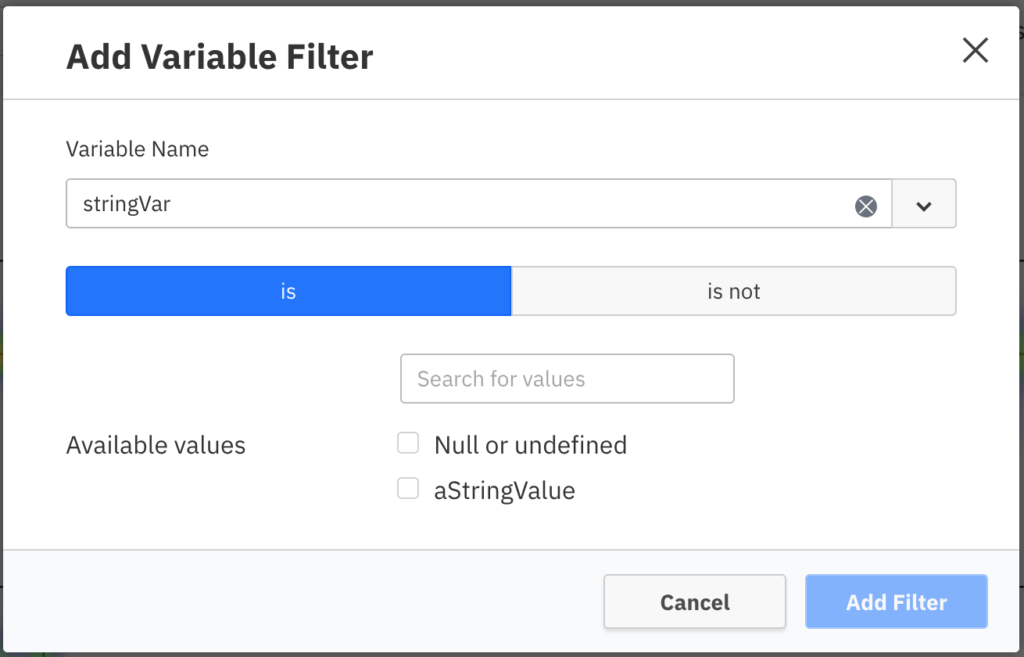
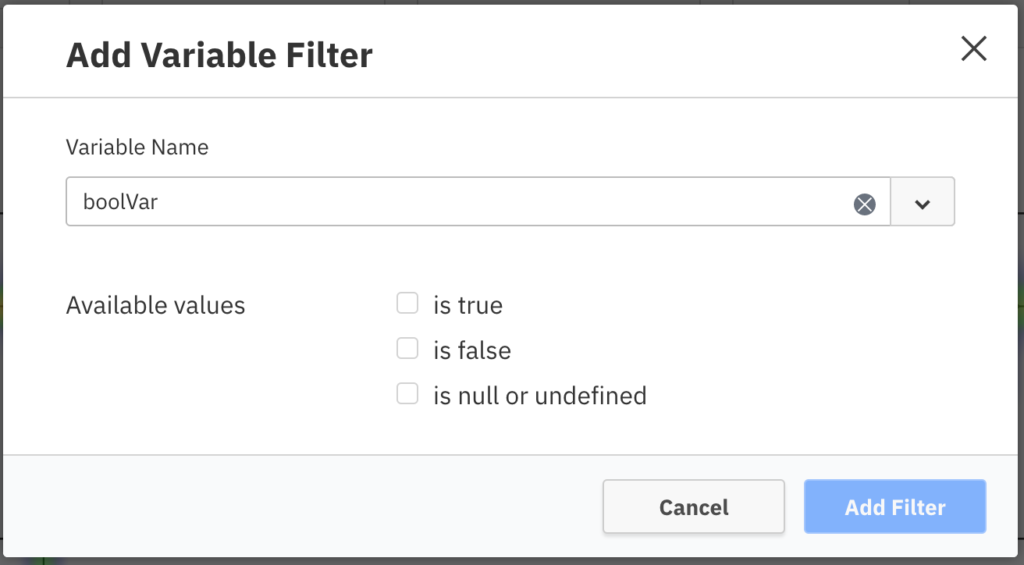
Besides improvements on date variables, we also improved the way we are handling filters for null and undefined values. The following screenshots show that it is now possible to easily select or deselect null values when filtering process instances.
Enhanced Trend Analysis and Flexible Data Buckets
Running instances
With this release we make trend analysis for process instances data even more powerful. Optimize 3.1 allows you to group the number of process instances by the running date. This allows you to quickly identify if there are more instances being started than completed over time. A growing number of running instances can, in certain situations, lead to underperforming processes. Therefore it is extremely important to continuously monitor this number.
The following screenshot shows how to set up a running instance report:

On top of this, you can also combine this report with other process instance count reports to see within one visualization how many instances were started, ended and running in a certain period of time.
New User Task Reports in regards to Assignee & Candidate Groups
In Optimize 3.0 we added User Task Trend Analysis by introducing “group by start & end date” for User Tasks. With this release we go even further and allow you to distribute the information by assignees or candidate groups.
This functionality allows you to easily identify how many User Tasks have been completed by assignees in a certain period of time.
You can find the new distribution capabilities in the Configuration Popover.
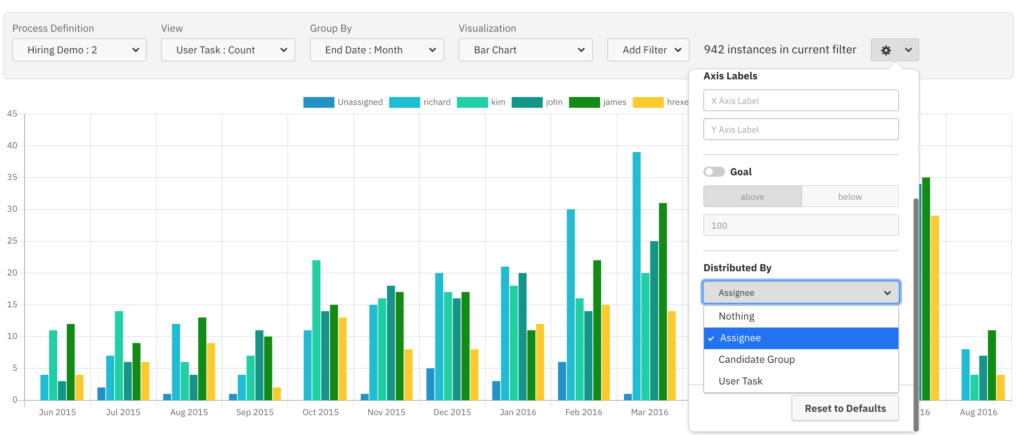
An example could look like this:

Variable Date and Number Buckets
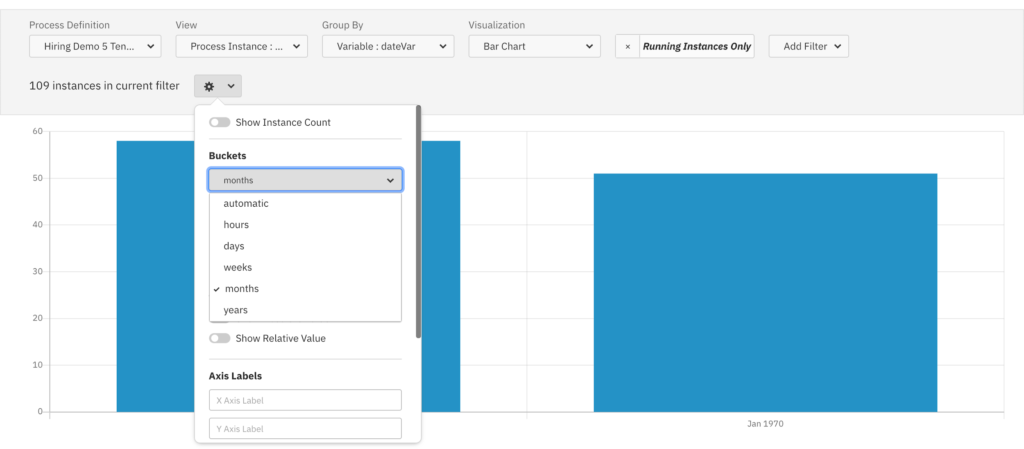
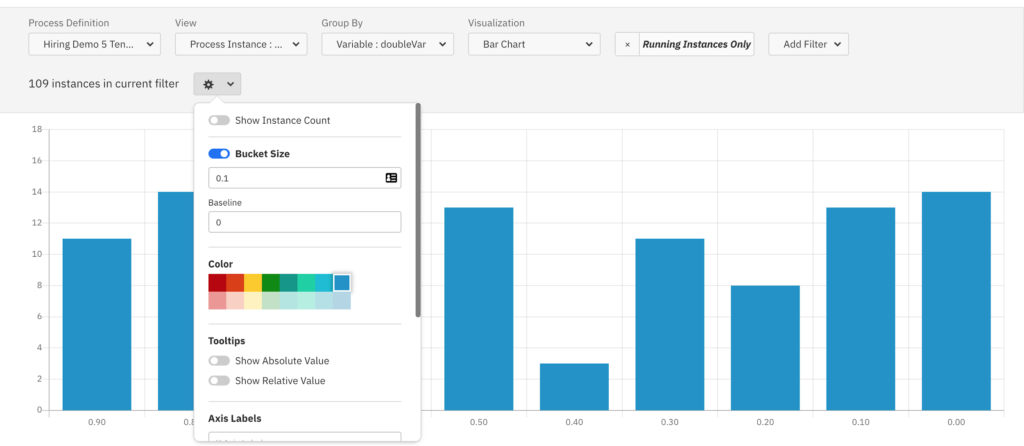
An additional improvement that allows you to create more useful results is related to data buckets. When grouping process data by date variables and number variables it is now possible to define the bucket sizes on your own.
For date variables you can switch between the known options in the Configuration Popover:
For number variables you have even more flexibility and can enter a width on your own:
Process Data Import and Cleanup Improvements
New Business Key Import Plugin Point
Camunda BPM allows you to define a business key for every process instance. Within Optimize the business keys are available so that you can identify specific process instances easily.
Sometimes business keys can contain confidential information that need to be anonymized. For this use case, we added a new Plugin Point within Optimize which allows you to hook into the Optimize import and adjust business keys during process instance imports.
You can find more detailed information in our documentation.
History Cleanup for Event Based Processes
Optimize allows you to automatically clean-up historical process instances based on process instance end date and a configured time-to-live.
With this release we enable history cleanup for event based processes as well.
This includes Camunda Event Data, externally ingested event data as well as the process instance information that Optimize creates based on your mapping of the event based process.
You can find more detailed information about setup and how it works in our documentation.
End-To-End Process Monitoring Improvements
We recently introduced Process Events Monitoring in Optimize which allows you to efficiently monitor and report on End-To-End processes that consist of one or multiple Camunda Processes, and even external process-related events.
In order to speed up the creation of Event Based Processes we are adding a new experimental feature to Optimize: When creating Event Based Processes, Optimize can now automatically generate a process model based on selected processes, external events and defined traced IDs:
In the first step you create a new Event Based Process by using the Autogenerate button:

Afterwards you select the sources you would like to use for your process:
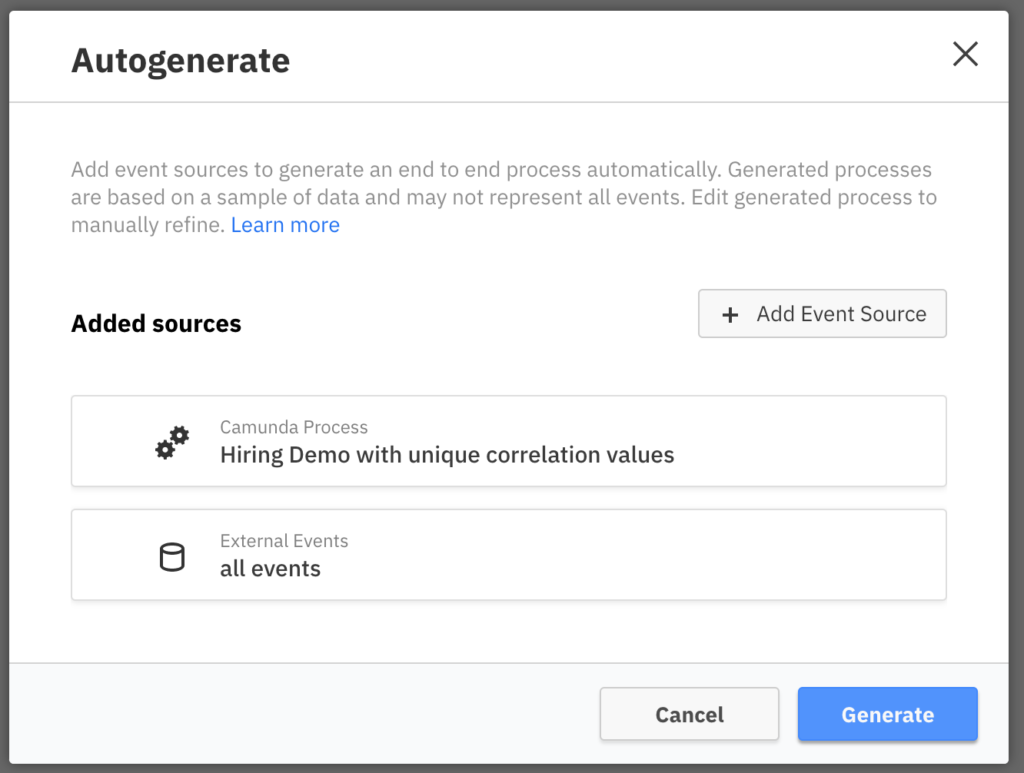
Optimize automatically proposes a process model based on the underlying process events:
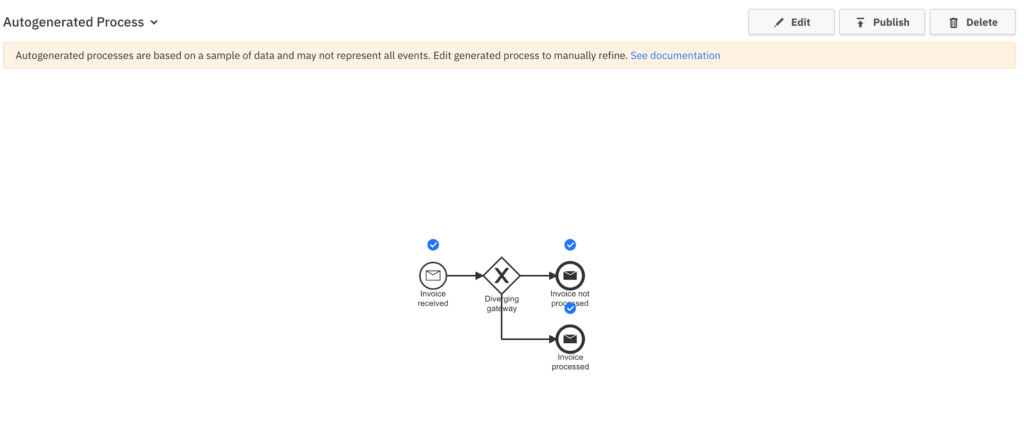
Please note that Optimize does not include all underlying events, but uses a sample of data to show you results quickly. This means you can use the diagram as a starting point and easily adjust it in the edit mode as needed. We also have separate documentation on this new feature.
When generating process models based on events for monitoring purposes many edge cases exist, so we decided to add this as an experimental beta feature. You can still map events manually, but potentially this new capability speeds up your mapping. Feel free to reach out to give us feedback as well.
How to get it
If you want to give Camunda Optimize a try, you can download the release here with your Enterprise customer credentials. Please sign up for a free 30-day trial version.
If you’re new to Optimize, we recommend that you watch the Getting Started with Optimize in less than 5 Minutes video.
