Monitoring is an essential facet of running applications in a production system.
Through this process, organizations collect and analyze data, and determine if a program is performing as expected within set boundaries. When combined with alerting, monitoring allows for detecting unexpected system behavior to mitigate exceptional situations as fast as possible. Furthermore, tracking the performance of a system enables organizations to improve those aspects that have the biggest impact with higher priority.
One essential aspect of monitoring is the list of key metrics you want to observe. There are different categories of statistics that can be of interest here.
To observe the defined metrics, there are plenty of application monitoring tools on the market today. They differ in many aspects such as licensing costs, integrations and plugins, alerting and reporting options, and supported programming languages and frameworks. In this article, we have a look at how you can monitor Camunda Platform 7 using open-source tools like Prometheus and Grafana.
This post explores the monitoring capabilities of Camunda Platform 7 using the Camunda Spring Boot Starter. As a result, we will have a monitoring dashboard of a running Camunda 7 instance with information on the Job Executor performance as well as insights into general metrics like the following:

We’ll also provide an overview of what is possible using the other supported environments and outline improvement ideas we have for Camunda 7 to make monitoring more convenient for users in the future.
Monitoring metrics
Based on past user and customer input, we differentiate two categories of monitoring metrics for Camunda Platform 7: performance metrics and usage metrics.
Performance metrics comprise the following:
- Job Executor threads active
- Job Executor threads idle/available in the pool
- Job Executor threads blocking
- Job Backlog, i.e., pending jobs that are due but not yet executed
Usage metrics are the process engine runtime statistics that Camunda 7 reports automatically. They comprise the following counters:
- Started and ended activity instances
- Acquired jobs
- Successfully executed and failed jobs
- Started process instances
You can read more about usage metrics in our user guide.
Additional out-of-scope metrics
There are two additional categories of metrics that can be insightful regarding application performance and behavior: process intelligence metrics and troubleshooting metrics.
Process intelligence metrics account for statistics per process definition like started and ended process instances, process instance cycle time, and the number of incidents. Those metrics are out of scope for this article as they can be best observed using Optimize.
Troubleshooting metrics are additional statistics that can help in root-causing unexpected system behavior. They include counters of running executions, overall and unassigned user tasks, event subscriptions, and process variables. While they can be of great assistance in root-causing a certain use case, actively monitoring them periodically can have a high impact on the overall system performance as they require database access for the retrieval of every data point.
You can find a more exhaustive list of troubleshooting metrics in our consulting repository.
Monitoring tools
To observe the metrics of Camunda Platform 7 instances, you need to extract the data from the running instances and display them in a meaningful way. For the purposes of this article, we will use Prometheus for data extraction and Grafana for dashboarding and alerting.
Prometheus is an open-source systems monitoring toolkit that collects and stores its metrics as time series data, i.e., metrics information is stored with the timestamp at which it was recorded, alongside optional key-value pairs called labels. You configure the data endpoints you want to periodically extract metrics from and Prometheus stores this information as time series data.
Grafana is an open-source toolkit that enables you to query, visualize, alert on, and explore your metrics, logs, and traces wherever they are stored. Grafana provides you with tools to turn time series data into insightful graphs and visualizations. Using Grafana Alerting, you can define alert rules and send alerts through a number of different channels, including PagerDuty, SMS, email, VictorOps, OpsGenie, or Slack.
Monitoring example – Spring Boot – Setup
With the monitoring metrics and tools in place, we can have a look at Camunda Platform 7 and how you can monitor the desired statistics using the Camunda Spring Boot Starter. Regarding monitoring, Spring Boot provides comprehensive capabilities with the Spring Boot Actuator project. You can use Actuator to provide metrics and health endpoints from your application that can be consumed by monitoring tools like Prometheus.
Spring Boot project
Using all the information gathered so far, we can add monitoring capabilities to a Camunda Spring Boot Starter-based project. Taking the web application example as a reference, we need to add the following Actuator and Prometheus dependencies:
<dependency>
  <groupId>org.springframework.boot</groupId>
  <artifactId>spring-boot-starter-actuator</artifactId>
</dependency>
<dependency>
  <groupId>io.micrometer</groupId>
  <artifactId>micrometer-registry-prometheus</artifactId>
</dependency>
Furthermore, we enable Actuator and the Prometheus endpoint in the src/main/resources/application.yml by adding the following line:
management.endpoints.web.exposure.include: prometheusBuilding and running the project using Maven as described in the example repository, we can navigate to http://localhost:8080/actuator/prometheus, enter the defined credentials (demo/demo), and inspect the exposed metrics of our application:

We can also find key statistics of the Camunda Job Executor(s) used in the Spring Boot application next to system, JVM, and Tomcat metrics. By default, the Camunda Spring Boot Starter configures the Job Executor to use Spring’s TaskExecutor with the name “camundaTaskExecutor”. Since Spring Boot 2.6, the metrics for task executors are exposed by default. This enables us to conveniently track Job Executor thread metrics out of the box which covers the major part of the performance metrics already.
Prometheus
Using this information, we can install and configure Prometheus to track those metrics. After following the Prometheus installation guide, we can configure it to scrape the Prometheus endpoint of our Spring Boot application to collect time series data:
# my global config
global:
  scrape_interval: 15s # Set the scrape interval to every 15 seconds. Default is every 1 minute.
  evaluation_interval: 15s # Evaluate rules every 15 seconds. The default is every 1 minute.
  # scrape_timeout is set to the global default (10s).

# A scrape configuration containing exactly one endpoint to scrape:
scrape_configs:
  # The job name is added as a label `job=<job_name>` to any timeseries scraped from this config.
  - job_name: "springboot"

    metrics_path: '/actuator/prometheus'
    # scheme defaults to 'http'.

    static_configs:
      - targets: ["localhost:8080"]

    basic_auth:
      username: demo
      password: demo
Starting Prometheus with the given configuration, we can verify that our application is indeed scraped for metrics data at http://localhost:9090/targets:

Using Prometheus’ graph feature, we can explore the scraped data to verify our application was successfully probed:

We can see that there are three core threads of the “camundaTaskExecutor” initially in our Spring Boot application. The Prometheus instance successfully scraped this data from our local Spring Boot application. With this foundation, we can move on to create more insightful monitoring dashboards using a tool like Grafana.
Grafana
After following Grafana’s installation guide, we navigate to http://localhost:3000, log in with the default credentials (admin/admin), and configure our Prometheus instance as a data source at http://localhost:3000/datasources. We add a new data source of type Prometheus and configure it accordingly. Afterward, we can create a dashboard using the time series data provided by our Prometheus instance. Refer to the dashboard guide for detailed information on Grafana dashboards. Prometheus also features a guide on Grafana itself.

Using the scraped monitoring metrics executor_active_threads{name="camundaTaskExecutor"} and executor_pool_size_threads{name="camundaTaskExecutor"} as queries in a dashboard panel, we can now track the job executor behavior of our application. If we notice job execution becoming slow, we can turn to our monitoring dashboard and inspect the number of active threads and the provided pool size. If all pooled threads are active, we can easily derive that we are hitting a limit on our thread capacity for the job executor.
This is the out-of-the-box metrics monitoring functionality that comes with the Camunda Spring Boot Starter, in combination with Spring Boot Actuator and monitoring tools like Prometheus and Grafana.
Monitoring example – Spring Boot – Health
One specific aspect of application monitoring is the health and availability of a system. Spring Boot Actuator provides various health indicators that connect to technologies you might be using in our Spring Boot application. The Camunda Spring Boot Starter integrates into this health infrastructure as well with the CamundaBpmActuatorConfiguration autoconfiguration. In order to enable health indicators for the process engine and the job executor, you can add the following to your Spring Boot application.yml:
management.endpoints.web.exposure.include: health
management.endpoint.health.show-details: always
Starting your Spring Boot application, you can navigate to http://localhost:8080/actuator/health/ to inspect the health status of the Job Executor and the process engine:

Monitoring example – Spring Boot – Advanced metrics
The metrics we covered so far comprise the basic performance metrics related to Job Executor threads. With Camunda Platform 7.18 and earlier, this is what you can extract out of the box. While the usage metrics are available via REST API, they are not served in the right format. Thus, Prometheus cannot directly consume them. Also, the Job Backlog cannot be directly extracted as a data point.
In a Spring Boot application, we can work around this issue by providing custom metrics using Micrometer’s MeterRegistry. For example, we can add a list of job-related metrics to Micrometer by adding the following class to our example Spring Boot project:
package org.camunda.bpm.spring.boot.example.web;

import io.micrometer.core.instrument.Gauge;
import io.micrometer.core.instrument.MeterRegistry;
import java.util.Objects;
import org.camunda.bpm.engine.ManagementService;
import org.camunda.bpm.engine.ProcessEngine;
import org.camunda.bpm.engine.management.Metrics;
import org.camunda.bpm.engine.management.MetricsQuery;
import org.camunda.bpm.engine.query.Query;
import org.springframework.context.annotation.Bean;
import org.springframework.context.annotation.Configuration;


@Configuration
public class CamundaMonitoringMetrics {

  private static final String NUMBER_OF_EXCLUSIVE_JOBS = "Number of exclusive jobs";
  private static final String NUMBER_OF_ACQUISITION_CYCLES = "Number of acquisition cycles";
  private static final String NUMBER_OF_JOBS = "Number of jobs";

  private final ManagementService service;

  public CamundaMonitoringMetrics(ProcessEngine engine) {
    super();
    Objects.requireNonNull(engine);
    this.service = engine.getManagementService();
  }

  @Bean
  public Gauge jobExecutionsSuccessful(MeterRegistry registry) {
    MetricsQuery query = service.createMetricsQuery().name(Metrics.JOB_SUCCESSFUL);

    return Gauge.builder("job.executions.successful", query::sum)
        .description("Successful job executions")
        .baseUnit(NUMBER_OF_JOBS)
        .register(registry);
  }

  @Bean
  public Gauge jobExecutionsFailed(MeterRegistry registry) {
    MetricsQuery query = service.createMetricsQuery().name(Metrics.JOB_FAILED);

    return Gauge.builder("job.executions.failed", query::sum)
        .description("Failed job executions")
        .baseUnit(NUMBER_OF_JOBS)
        .register(registry);
  }

  @Bean
  public Gauge jobExecutionsRejected(MeterRegistry registry) {
    MetricsQuery query = service.createMetricsQuery().name(Metrics.JOB_EXECUTION_REJECTED);

    return Gauge.builder("job.executions.rejected", query::sum)
        .description("Rejected jobs due to saturated execution resources")
        .baseUnit(NUMBER_OF_JOBS)
        .register(registry);
  }

  @Bean
  public Gauge jobAcquisitionsAttempted(MeterRegistry registry) {
    MetricsQuery query = service.createMetricsQuery().name(Metrics.JOB_ACQUISITION_ATTEMPT);

    return Gauge.builder("job.acquisitions.attempted", query::sum)
        .description("Performed job acquisition cycles")
        .baseUnit(NUMBER_OF_ACQUISITION_CYCLES)
        .register(registry);
  }

  @Bean
  public Gauge jobAcquisitionsSuccessful(MeterRegistry registry) {
    MetricsQuery query = service.createMetricsQuery().name(Metrics.JOB_ACQUIRED_SUCCESS);

    return Gauge.builder("job.acquisitions.successful", query::sum)
        .description("Successful job acquisitions")
        .baseUnit(NUMBER_OF_JOBS)
        .register(registry);
  }

  @Bean
  public Gauge jobAcquistionsFailed(MeterRegistry registry) {
    MetricsQuery query = service.createMetricsQuery().name(Metrics.JOB_ACQUIRED_FAILURE);

    return Gauge.builder("job.acquisitions.failed", query::sum)
        .description("Failed job acquisitions")
        .baseUnit(NUMBER_OF_JOBS)
        .register(registry);
  }

  @Bean
  public Gauge jobLocksExclusive(MeterRegistry registry) {
    MetricsQuery query = service.createMetricsQuery().name(Metrics.JOB_LOCKED_EXCLUSIVE);

    return Gauge.builder("job.locks.exclusive", query::sum)
        .description("Exclusive jobs that are immediately locked and executed")
        .baseUnit(NUMBER_OF_EXCLUSIVE_JOBS)
        .register(registry);
  }

  @Bean
  public Gauge dueJobsInDB(MeterRegistry registry) {
    Query jobQuery = service.createJobQuery().executable().messages();

    return Gauge.builder("jobs.due", jobQuery::count)
        .description("Jobs from async continuation that are due").register(registry);
  }
}
You can add all other usage metrics from the defined list of Metrics in a separate Bean method to this class.
Note that Camunda engine usage metrics are disabled in the web application example. Thus, we have to enable usage metrics in the src/main/resources/application.yml file by removing the following lines:
camunda.bpm.metrics:
    enabled: false
    db-reporter-activate: false
Grafana
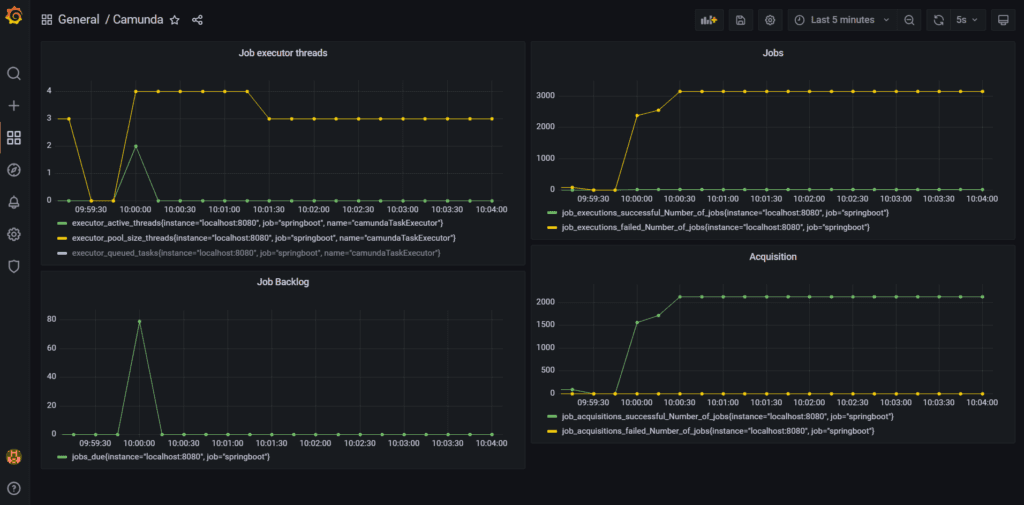
With the newly added usage metrics at hand, we can enhance our Grafana dashboard. For example, we can now add queries on the jobs, acquisition, and Job Backlog:
Such a monitoring dashboard provides good insight into how the Job Executor performs. It helps understand the throughput and potential limitations of the current configuration. Using the Camunda 7 Spring Boot Starter, you can leverage the available data starting today.
Other supported environments
Camunda Platform 7 supports various runtime environments, ranging from enterprise application servers like WebSphere to Spring Boot and Camunda Run. As outlined for Spring Boot above, the basic performance metrics related to thread data are usually provided by the runtime environment itself. The following capabilities exist in the supported environments:
- WebSphere – This server uses JCA’s WorkManagers in the Job Executor. Use the WebSphere metrics app as documented to monitor work managers with Prometheus.
- Weblogic – This server uses CommonJ’s WorkManagers in the Job Executor. Use the WebLogic Monitoring Exporter as documented to monitor work managers with Prometheus.
- WildFly – This server uses the ManagedQueueExecutorService in the Job Executor. Use the MicroProfile configuration as documented to monitor executor services with Prometheus.
- Tomcat – This server provides no integrated server monitoring. You can use the Prometheus Java client in a custom servlet application.
For all the environments mentioned above, you can also use a Prometheus exporter instead. There are dedicated exporters for each of those servers.
Camunda Platform Run
At its core, Camunda Run is a Spring Boot application, pre-packaged by Camunda. Thus, using Spring Boot Actuator as outlined in the previous sections enables monitoring for Camunda Run in the same way. However, due to its pre-packaged nature, you cannot add the Actuator dependencies in the same manner as for a Spring Boot application. Instead, additional dependencies can be added to the configuration/userlib directory of your Camunda Run distribution. In the case of Actuator and Prometheus, you need to add the following dependencies:
- HdrHistogram
- LatencyUtils
- micrometer-core
- micrometer-registry-prometheus
- spring-boot-actuator
- spring-boot-actuator-autoconfigure
The versions of those libraries depend on the specific Spring Boot version used by your Camunda Run distribution. One way of identifying this version is to look at the version number of the spring-boot-starter-web artifact in the internal/webapps directory. With the Spring Boot version extracted, you can consult the related Spring Boot dependencies artifact for the versions of the mentioned libraries.
For Camunda Run 7.18.0 and 7.17.6 you need to add:
- HdrHistogram-2.1.12
- LatencyUtils-2.0.3
- micrometer-core-1.9.3
- micrometer-registry-prometheus-1.9.3
- spring-boot-actuator-2.7.3
- spring-boot-actuator-autoconfigure-2.7.3
For Camunda Run 7.17.0 you need to add:
- HdrHistogram-2.1.12
- LatencyUtils-2.0.3
- micrometer-core-1.8.3
- micrometer-registry-prometheus-1.8.3
- spring-boot-actuator-2.6.4
- spring-boot-actuator-autoconfigure-2.6.4
Future versions of Camunda Run might bring along Actuator support baked-in. That way, application monitoring would become more accessible to all Camunda Run users, regardless of their expertise in handling Java artifacts.
Advanced metrics
Providing advanced metrics can currently not be done without custom code or a custom application, depending on the environment. For custom Spring Boot applications, the sections above detail how to achieve this. For every other environment, you have to create a similar custom application that uses the metrics and monitoring framework specific to that environment. Future versions of Camunda Platform 7 might feature usage metrics and Job Backlog metrics exposed in Prometheus format out of the box. This would enable a broader user base to monitor those metrics without the need for custom code and applications.
Monitoring Outlook
This article provides a practical guide on how to do application monitoring for Camunda Platform 7. It also highlights some of the areas where more out-of-the-box capabilities would enable more users to conveniently set up application monitoring for their Camunda 7 instances.
Stay tuned and follow our tracking issue for future updates on this topic!


