At Camunda we have a mantra: Automate Any Process, Anywhere. Additionally, we’ll often say “eat your own dog food,” or “drink your own champagne.”
Two years ago, I wrote an article about how we can use Zeebe to orchestrate our chaos experiments; I called it: BPMN meets chaos engineering. That was the result of a hack day project, in which I worked alongside my colleague Philipp Ossler.
Since then, a lot of things have changed. We made many improvements to our tooling, like creating our own chaos toolkit zbchaos that makes it easier to run chaos experiments against Zeebe (which reached v1.0), improving the BPMN models in use, adding more experiments to it, etc.
Today, I want to take a closer look at how we automate and orchestrate our chaos experiments with Zeebe against Zeebe. After reading this you will see how beneficial it is to use Zeebe as your chaos experiment orchestrator.
The use cases are endless—you can use this knowledge in order to orchestrate your own chaos experiments, set up your own QA test suite or use Zeebe as your CI/CD framework.
We will show you how you leverage the observability of the Camunda Platform stack and how it can help you to understand what is currently executed or where issues may lie.
But first, let’s start with some basics.
Chaos engineering and experiments
“Chaos Engineering is the discipline of experimenting on a system in order to build confidence in the system’s capability to withstand turbulent conditions in production.”
–principlesofchaos.org
One of the principles of chaos engineering is automating defined experiments to ensure that no regression is introduced into the system at a later stage.
A chaos experiment consists of multiple stages; three are important for automation:
- Verification of the steady state hypothesis
- Running actions to introduce chaos
- Verification of the steady state hypothesis (that it still holds or has recovered)
These steps can also be cast into a BPMN model, as shown below:

That is the backbone of our chaos experiment orchestration.
Let’s take a closer look at the process models we designed and use now to automate and orchestrate our chaos experiments.
BPMN meets chaos engineering
If you are interested in the resources take a look at the corresponding GitHub repository zeebe-io/zeebe-chaos/.
Chaos toolkit
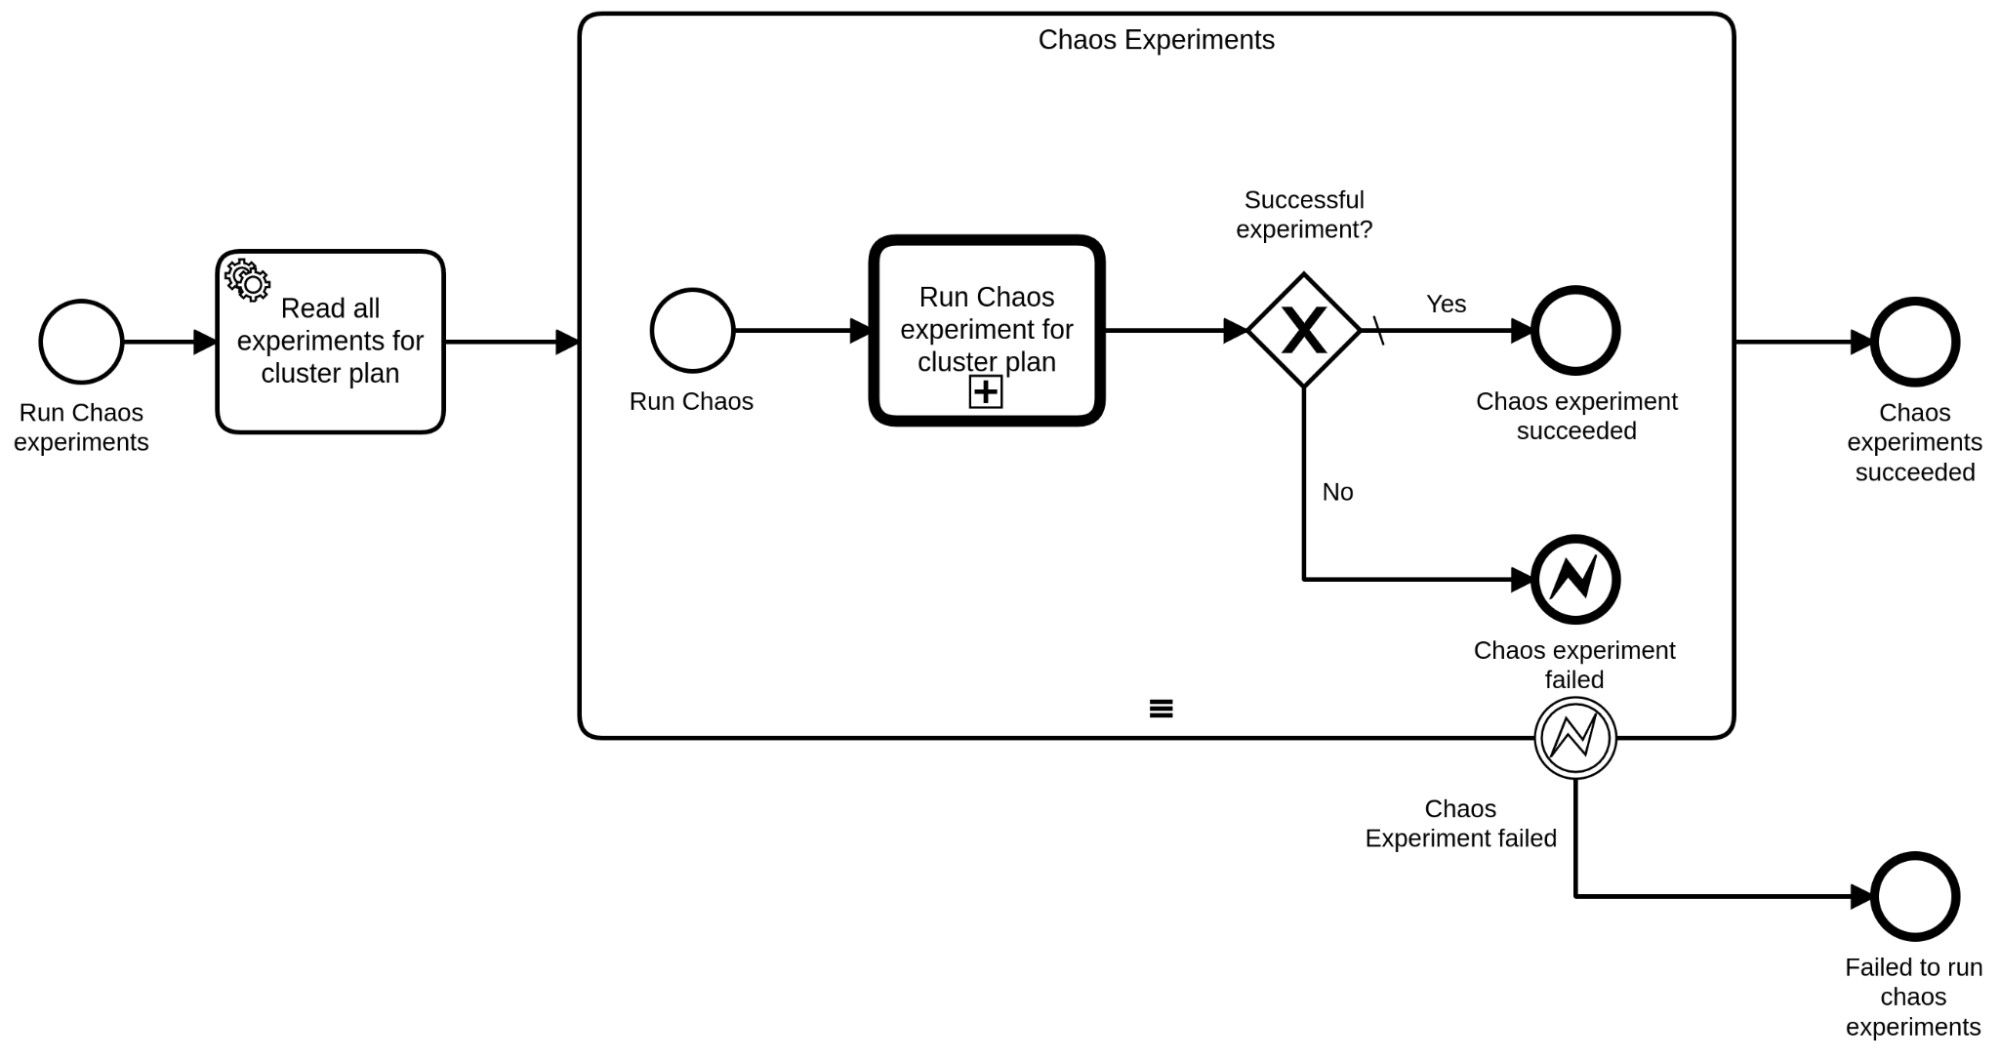
The first process model is called: “chaosToolkit” because it bundles all chaos experiments together. It reads the specifications of all existing chaos experiments (the specification for each experiment is stored in a JSON file, which we will see later) and executes them one by one via a sequential multi-instance.
For readers with knowledge of BPMN, be aware that in earlier versions of Zeebe it was not possible to transfer variables with BPMN errors, which is why we used return values of CallActivities and later interrupted the SubProcess.
Chaos experiment
The second BPMN model describes a single chaos experiment, which is why it is called “chaosExperiment”. It has similarities (the different stages) to the simplified version above.
Here we see the three stages, verification, introducing chaos, and verification of the steady state again.

All of the call activities above are delegated to the third BPMN model.
Action
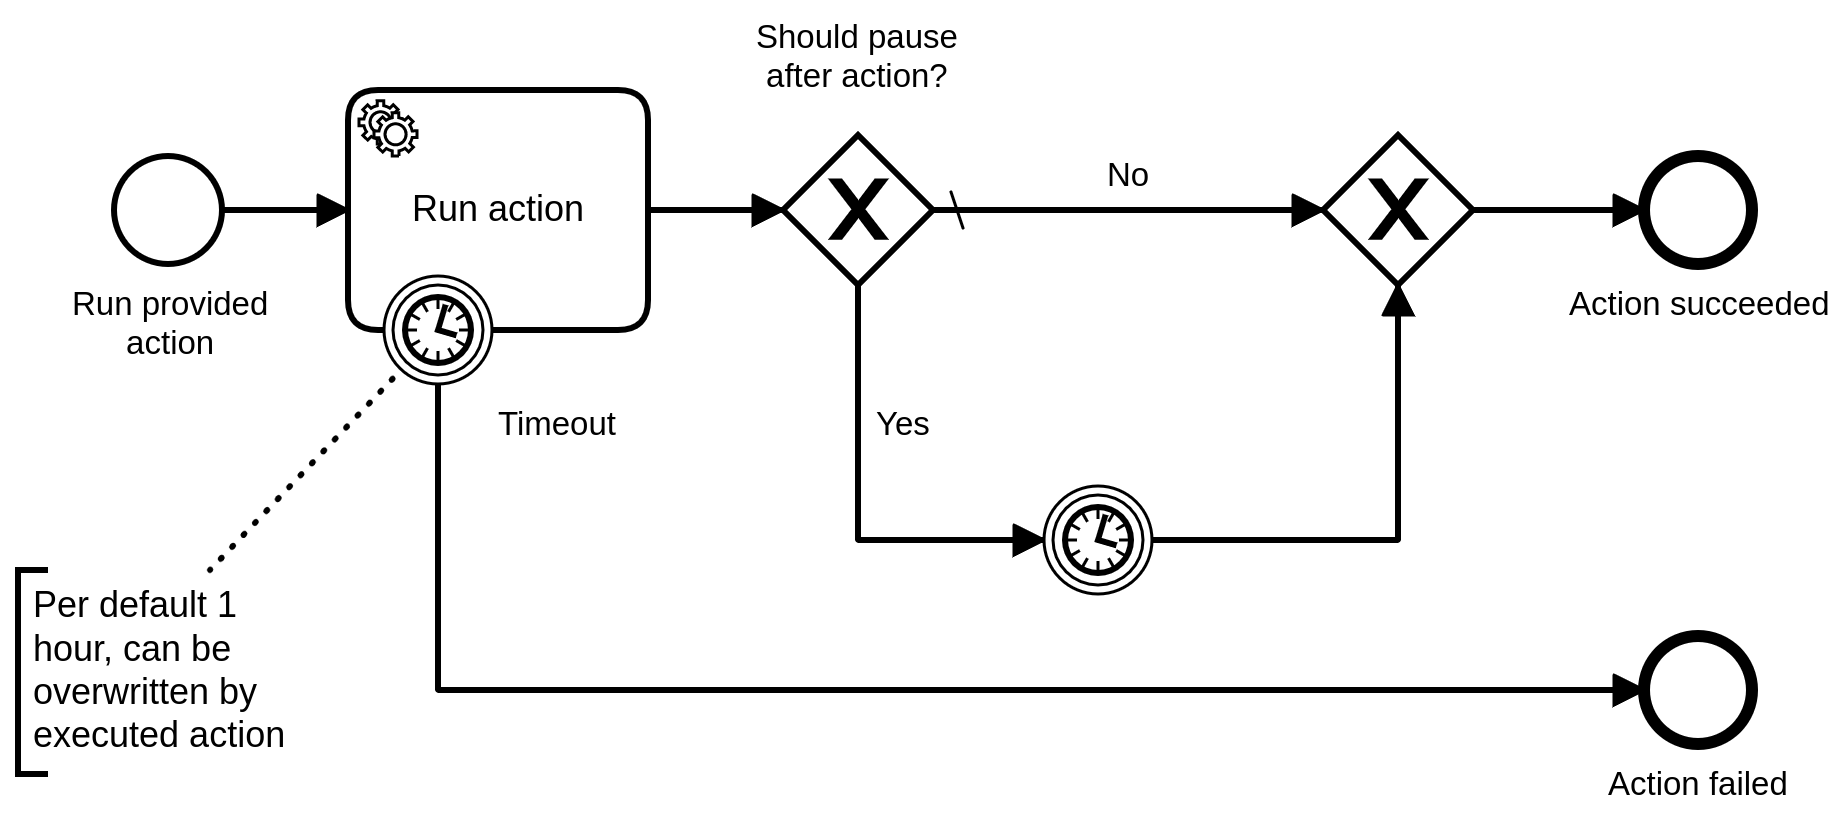
The third model is the most generic one. It will execute any action, which is defined in the process instance payload. The payload will be a chaos experiment specification. The specification can also contain timeouts and pause times which are reflected in the model as well.
Specification
As we have seen, the BPMN process models are quite generic and all of them are enlivened via a chaos experiment specification.
The chaos experiment specification is based on OpenChaos initiative and the Chaos Toolkit specification. We reused this specification to run these experiments as well with chaosToolkit (to run it locally).
An example is the following experiment.json
{
    "version": "0.1.0",
    "title": "Zeebe follower restart non-graceful experiment",
    "description": "Zeebe should be fault-tolerant. Zeebe should be able to handle followers terminations.",
    "contributions": {
        "reliability": "high",
        "availability": "high"
    },
    "steady-state-hypothesis": {
        "title": "Zeebe is alive",
        "probes": [
            {
                "name": "All pods should be ready",
                "type": "probe",
                "tolerance": 0,
                "provider": {
                    "type": "process",
                    "path": "zbchaos",
                    "arguments": ["verify", "readiness"],
                    "timeout": 900
                }
            },
            {
                "name": "Can deploy process model",
                "type": "probe",
                "tolerance": 0,
                "provider": {
                    "type": "process",
                    "path": "zbchaos",
                    "arguments": ["deploy", "process"],
                    "timeout": 900
                }
            },
            {
                "name": "Should be able to create process instances on partition 1",
                "type": "probe",
                "tolerance": 0,
                "provider": {
                    "type": "process",
                    "path": "zbchaos",
                    "arguments": ["verify", "instance-creation", "--partitionId", "1"],
                    "timeout": 900
                }
            }
        ]
    },
    "method": [
        {
            "type": "action",
            "name": "Terminate follower of partition 1",
            "provider": {
                "type": "process",
                "path": "zbchaos",
                "arguments": ["terminate", "broker", "--role", "FOLLOWER", "--partitionId", "1"]
            }
        }
    ],
    "rollbacks": []
}
The first key-value pairs describe the experiment itself. The steady-state-hypothesis and its content describe the verification stage. All of the probes inside the steady-state-hypothesis are executed as actions in our third process model.
The method object is describing the chaos which should be inserted into the system. In this case, it consists of one action, restarting a follower (a broker which is not leader of Zeebe partition).
I don’t want to go into much detail about the specification itself, but you can find several examples of our experiments we already have defined here https://github.com/zeebe-io/zeebe-chaos/tree/main/go-chaos/internal/chaos-experiments
Automation
Let’s imagine we have a Zeebe cluster which we want to run the experiments against. We call it Zeebe target.
As mentioned earlier, the specification is based on the chaos toolkit. This means we can (if we have zbchaos and chaos toolkit installed) run it locally via `chaos run experiment.json`. If Zeebe is installed in Kubernetes and we have the right Kubernetes context set, this would work with zbchaos out of the box.
Zeebe Testbench
Another alternative is orchestrating the previous example with Zeebe itself. We’ll do this by using a different Zeebe cluster which we’ll call Zeebe Testbench.

Our Zeebe Testbench cluster is in charge of orchestrating the chaos experiments. zbchaos, is a job worker in this case and executes all actions. For example, verifying the healthiness of the cluster or of a node, terminating a node, creating a network partition, etc.
We have seen in the chaos experiment specification above that all actions and probes are referencing zbchaos and specifying subcommands. These are executed no matter if zbchaos is used as a CLI tool directly or as a job worker. This means if you execute the chaos specification with the chaos toolkit it will execute the zbchaos CLI. If you orchestrate the experiments with Zeebe, the zbchaos workers will handle the specific actions.
From outside we are deploying the previously mentioned chaos models in Zeebe Testbench. This can happen on the set up of the Zeebe Testbench cluster (or when something changes on the models). New instances can be created either by us locally (e.g. via zbctl, or any other client), via a Timer, or by our GitHub actions.
With our GitHub actions, it is fairly easy to trigger a new Testbench run, which includes all chaos experiments, and some other tests.

To make this even greater, we even have automation to create the Zeebe Target cluster automatically. That can happen before each chaosToolkit execution. This allows us to always start with a clean state. Otherwise, errors might be hard to reproduce (and not to waste resources if no experiment is running).
Run chaos experiments regularly
We run our chaos experiments regularly. This means we create a chaosToolkit process instance every day and execute all chaos experiments against a new Zeebe target cluster. The creation of such process instances happens with earlier mentioned Github actions. This allows us to integrate this more in our CI which we also use in releases, meaning that we can run such tests before every release.
You can find the related GitHub action here:
If an experiment fails or all succeed we are notified in Slack with the help of a Slack Connector.
This happens outside of the chaosToolkit process, which is essentially wrapped again around other larger process models to automate other parts. As I mentioned before, creating clusters, notifications, deleting clusters, etc.
Benefits
Observability
With Operate, you can observe a current running chaos experiment, what cluster it targets, what experiment and action it is currently executing, etc.
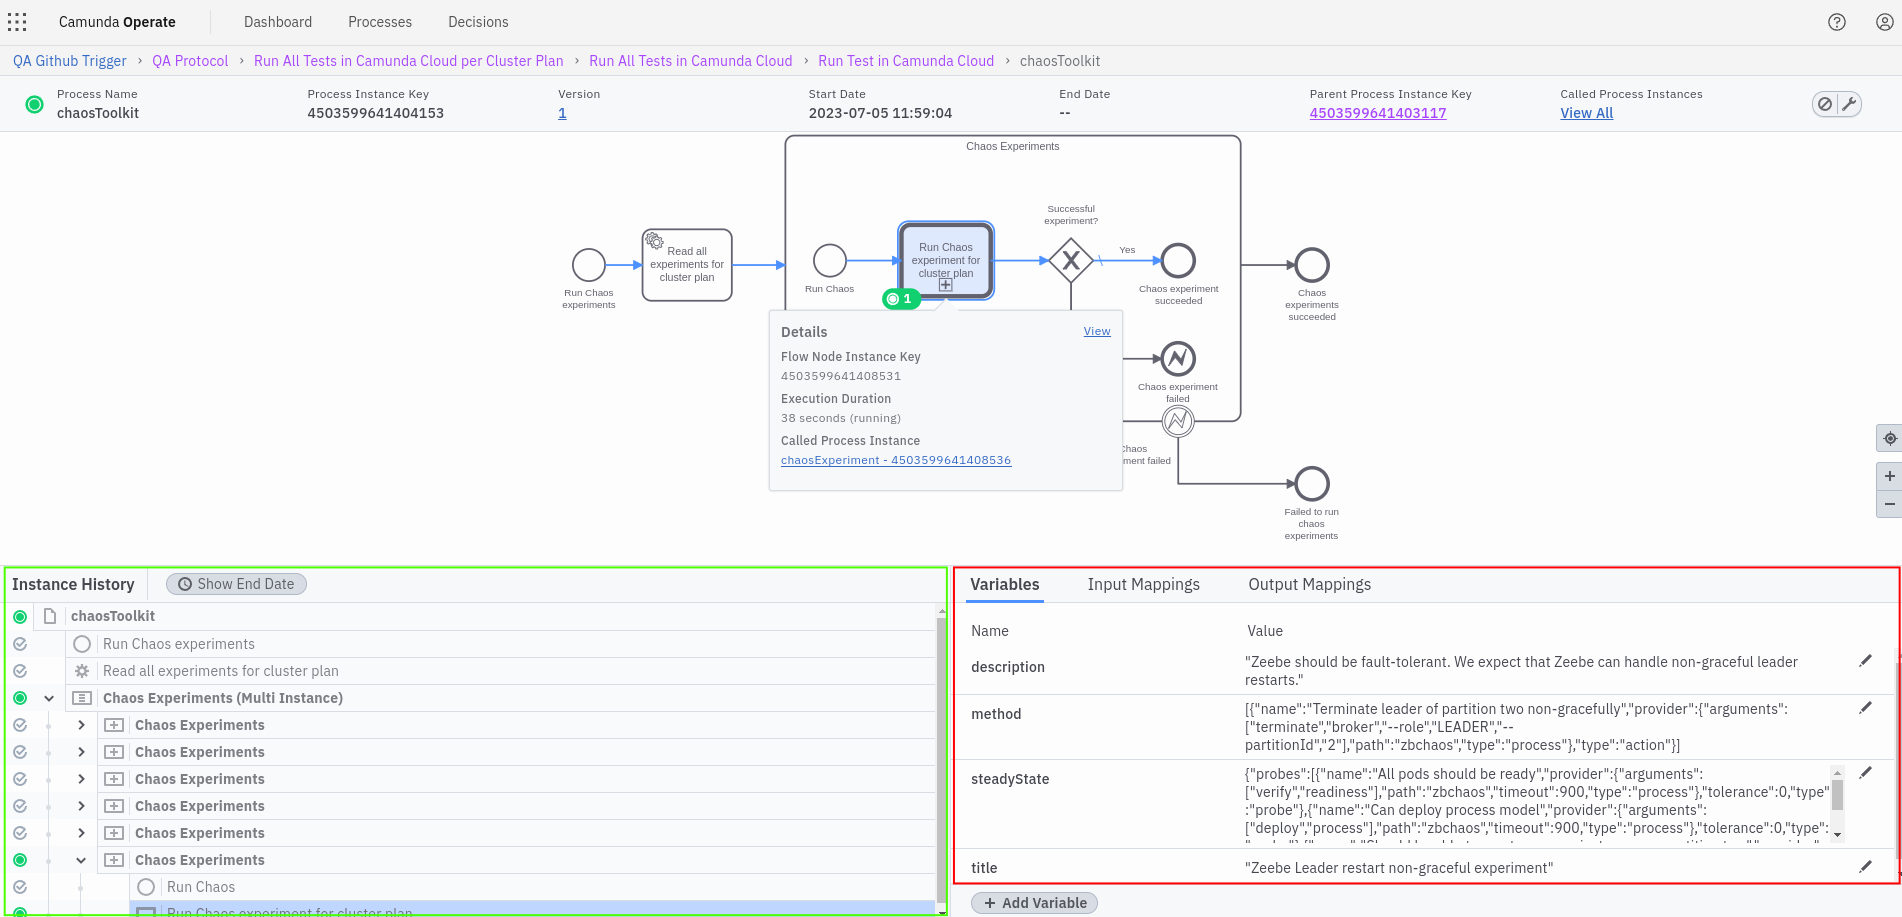
In the screenshot above, we can see a currently running chaosToolkit process instance. We can observe how many experiments have been executed (on the left in the “Instance History” green highlighted) and how many we still need to process (based on Variables).
Furthermore, we can see in the Variables tab (with the red border) what type of experiment we currently execute: “Zeebe should be fault-tolerant. We expect that Zeebe can handle non-graceful leader restarts”, and there is even more to dive into.
If we dig deeper into the current running experiment (we can do that via following the call-activity link) we can see that we are in the verification stage.
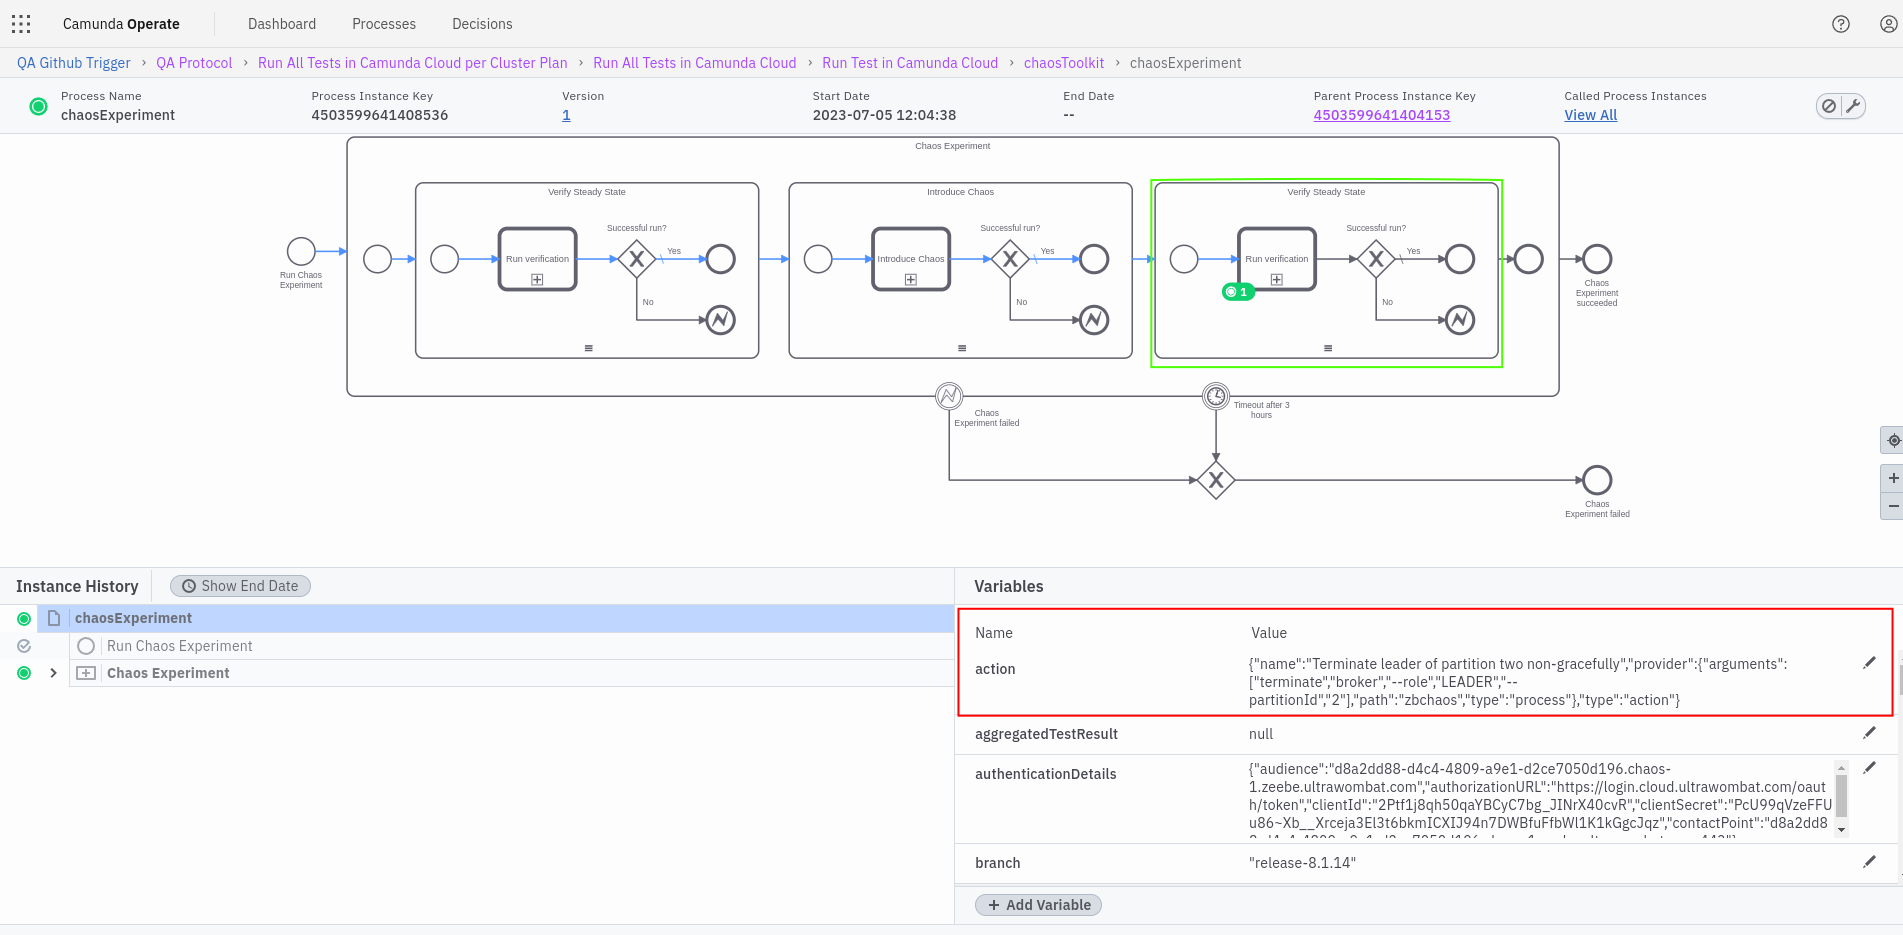
In the verification after the chaos has been introduced (highlighted in green). We can investigate which chaos action has been executed, like here (highlighted in red): “Terminate leader of partition two non-gracefully”.
When following the call activity again we see which verification is currently executed.
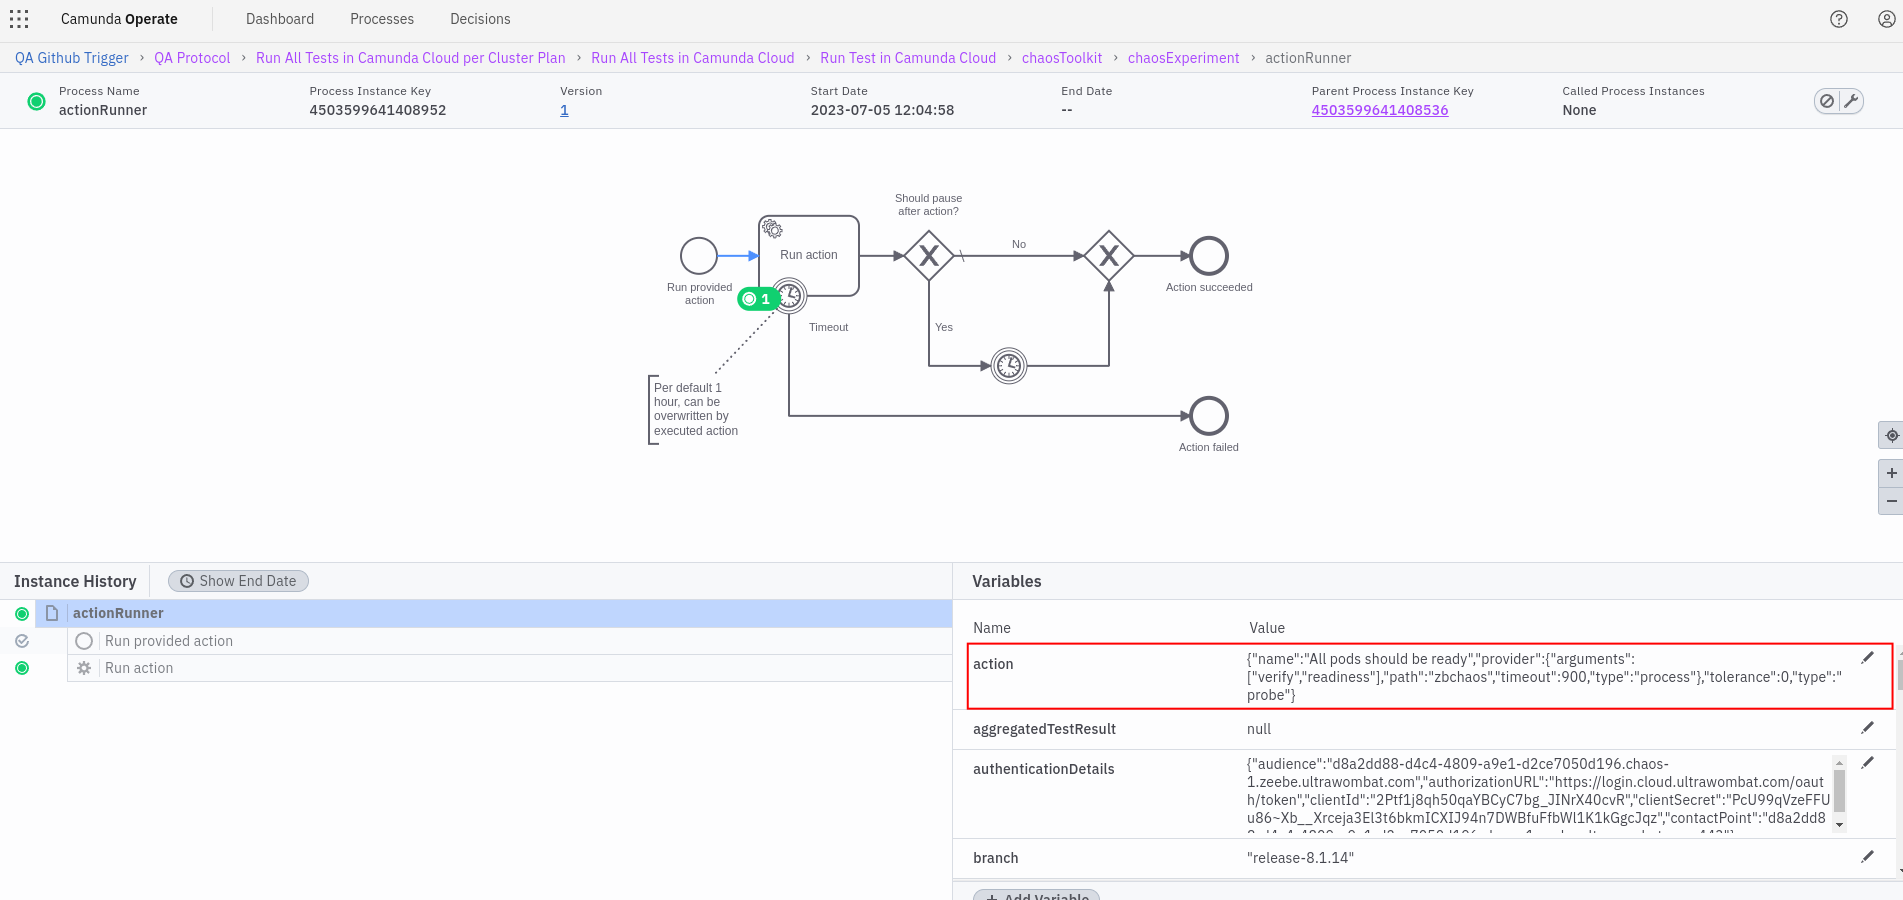
We are verifying that all pods are ready again after the leader of partition two has been terminated. This information can be extracted from the variables (highlighted in red).
As Operate keeps the history of a process, we can also take a look at past experiments. You can check and verify which actions or chaos has been introduced.
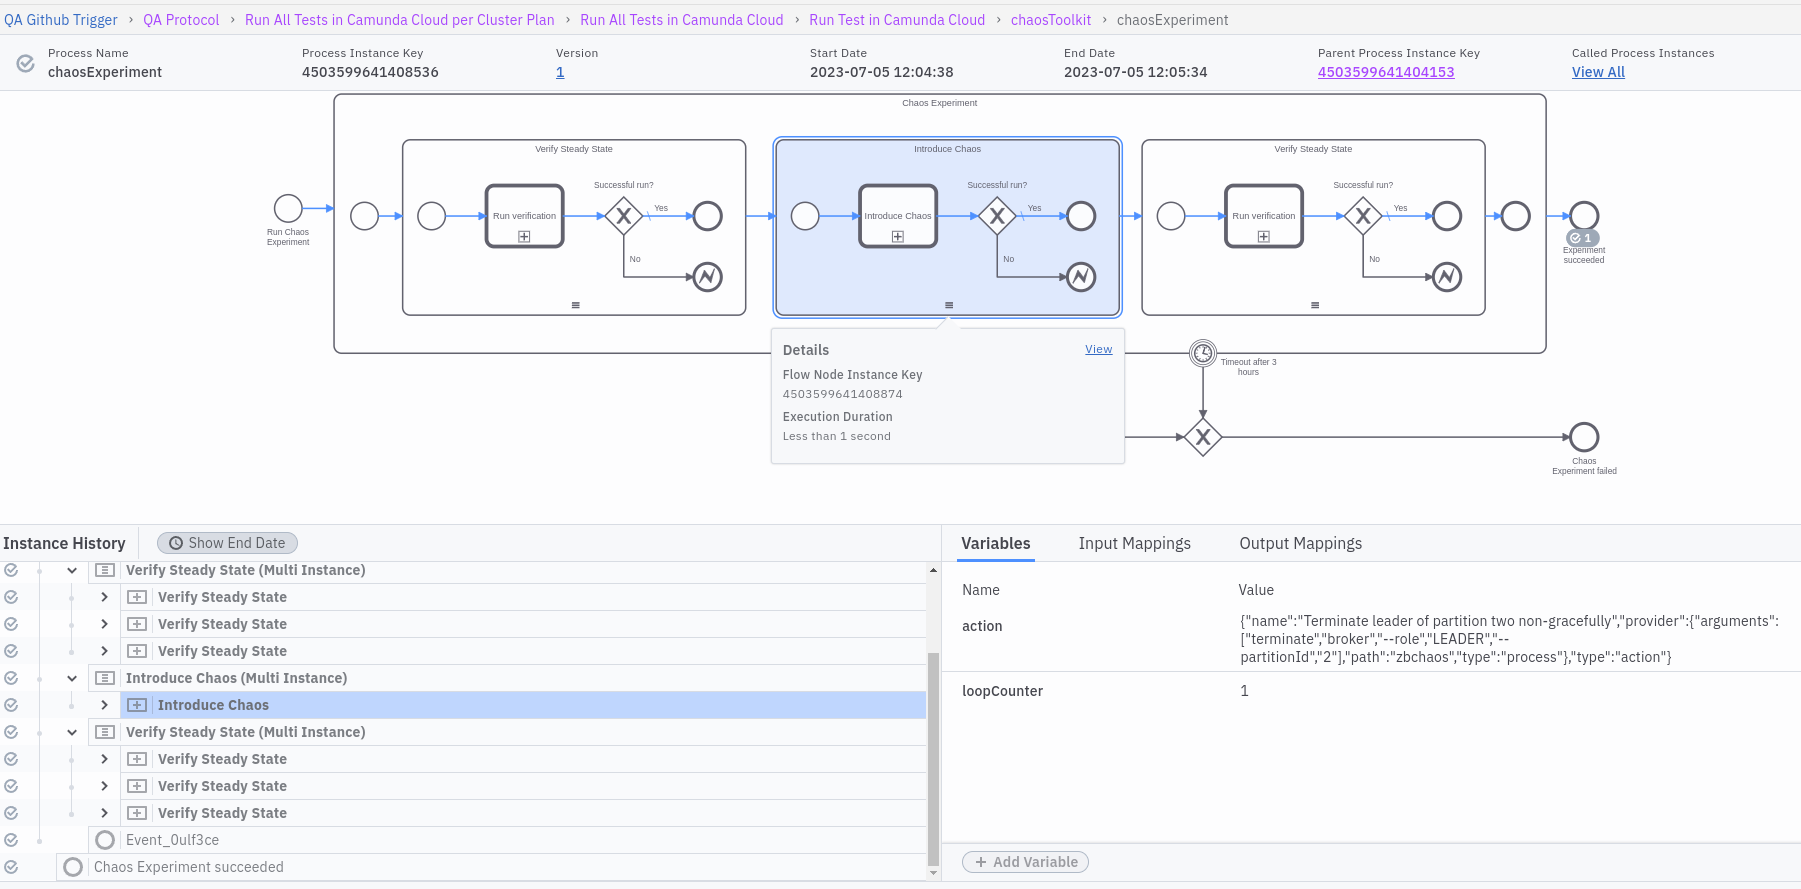
You can see a large history of executed chaos experiments, actions, and several other details.

This high degree of observability is important if something fails. Here you will see directly at which stage your experiment failed, what was executed before, etc. The incident message (depending on the worker) can also include a helpful note about why a stage failed.
Drink your own champagne
This setup might sound a bit complex at first, but once you understand the generic approach it actually isn’t and in contrast to scripting it, the BPMN automation greatly benefits observability.
Furthermore, with this approach, we are still able to execute our experiments locally (which helps with development and debugging) and are able to automate them via our Zeebe Testbench cluster. It is fairly easy to use and execute new QA runs on demand. We drink our own champagne which helps us to improve our overall system, and that is actually the biggest benefit of this setup.
It just feels correct to use our own product to automate our own processes. We can sit in the driver’s seat of the car we build and ship, feel what our users feel, and can improve based on that. It allows us to find bugs/issues earlier on, to improve in metrics and other observability measures, and build up confidence that our system can handle certain failure scenarios and situations.
I hope this was helpful to you and enlightened you a bit about what you can do with Zeebe. As I mentioned in the start the use cases and possibilities to use Zeebe are endless, and the whole Camunda Platform stack supports that pretty well.
—
Thanks to Christina Ausley, Deepthi Akkoorath and Sebastian Bathke for reviewing this blog post.
