Let’s continue with our blog series “Treat your processes like code – test them!” Today we will take a closer look at a frequently discussed topic: Test coverage. But what role does coverage play in testing BPMN models and how can coverage be measured?
In this post we will address the following questions:
- Why do we need coverage?
- How can we measure coverage in BPMN processes?
- How can we monitor the coverage in a transparent way?
- This post will also give a short preview of how Camunda BPM Process Test Coverage is evolving.
For this purpose, we are going to extend the example from our previous posts. You can find it in our GitHub repository. If you haven’t read them already, check out the other posts in this series:
Why is test coverage an important metric for developing automated processes? The short answer is: From a technical perspective, BPMN is a programming language, so it should be treated as one. High test coverage brings many benefits, for example:
- Greater confidence in the model: Automated processes include workflow logic, dependencies on data, and can grow over time. If there is no certainty that all paths will still work when a change is made, this has a negative impact on agility. This is because a lack of trust in a change to the model often means that new versions are deployed less frequently and acceptance tests become more costly.
- Errors are detected at an early stage: When testing models in detail, technical and functional errors in the model can be detected at an early stage. After all, not only errors in the process logic are relevant. Testing at the technical level often reveals states in the model that are not desired from a business perspective.
- Tests are definitely executed: If test coverage is included as a key figure in the development and integrated into the pipeline, then there is no way around executing the tests. This creates a higher level of confidence in the deployment. In addition, seamless and automated integration means that measuring this metric is not an additional effort.
But how can we monitor test coverage when developing automated processes?
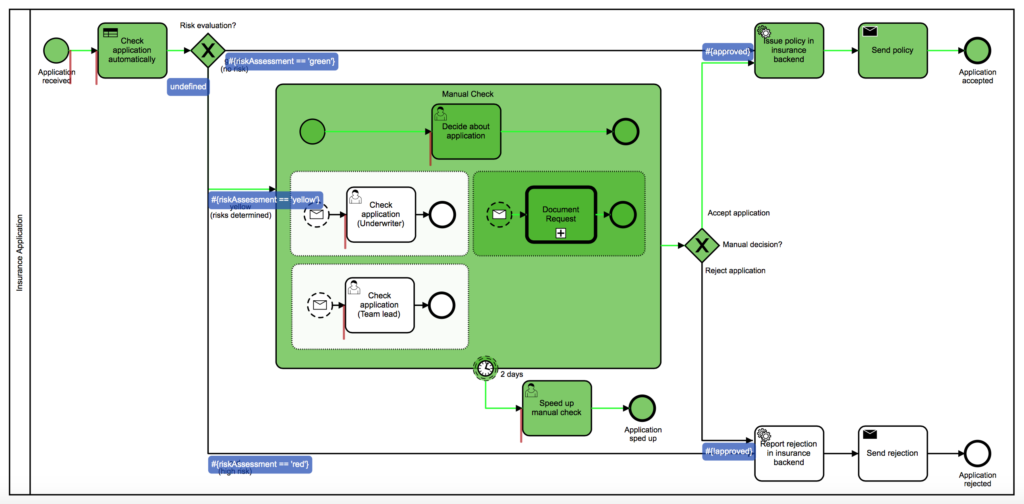
There is a community extension for this: Camunda BPM Process Test Coverage. It visualizes and checks the coverage of the process model. Running JUnit tests creates HTML files in the build folder. These look like this:

The extension offers the following features:
- Visualization of the results of test methods and test classes in the BPMN model
- Visualization of expressions on sequence flows and service tasks
- Visualization of transaction boundaries
- Calculation and visualization of the degree of coverage
Let’s extend our example. For this, we first check out the branch 02_process_dependencies in our GitHub repository. There are only three steps required for the initial setup:
Adding the maven dependencies
1. First, we have to add the following dependency to our project’s pom.xml:
1.	<dependency>
2.	  <groupId>org.camunda.bpm.extension</groupId>
3.	  <artifactId>camunda-bpm-process-test-coverage</artifactId>
4.	  <version>0.3.2</version>
5.	  <scope>test</scope>
</dependency>
2. Updating the camunda-cfg.xml file:
1.	<bean id="processEngineConfiguration"
2.	   class="org.camunda.bpm.extension.process_test_coverage.junit.rules.ProcessCoverageInMemProcessEngineConfiguration">
3.	   ...
</bean>
3. Using TestCoverageProcessEngineRule in the test:
For this, let’s customize our WorkflowTest and change the @Rule as follows:
1.	    @Rule
2.	    @ClassRule
3.	    public static TestCoverageProcessEngineRule rule = TestCoverageProcessEngineRuleBuilder.create()
4.	            .excludeProcessDefinitionKeys(DELIVERY_PROCESS_KEY)
            .build();
It is important that we exclude the Delivery Process from the coverage. This is because it is only provided as a mock in the test and is therefore not available.
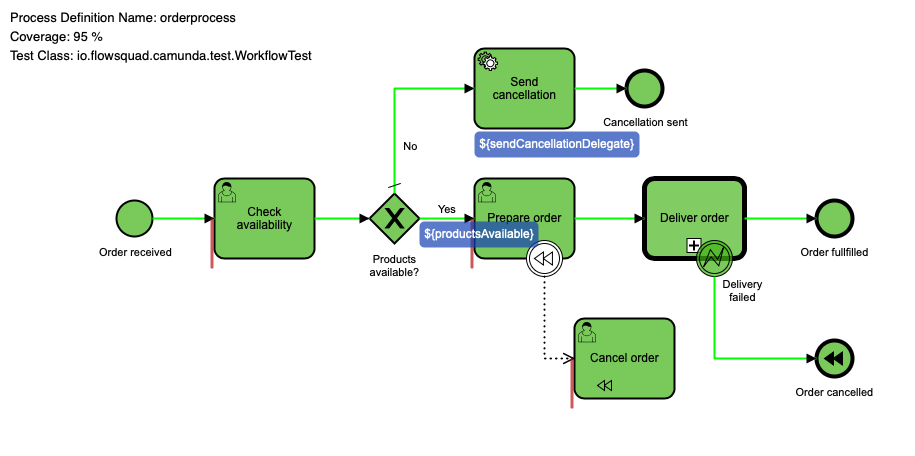
Now we can run the test. The test results will end up in ./target/process-test-coverage.

As we can see, we reached 95% coverage even though everything was tested successfully. However, this is due to a bug in the coverage library that does not track compensation events properly.
Defining the minimum coverage
Let’s now have a look at how we can define the minimum coverage that will be automatically monitored. We have two options for this:
- Coverage on the class level
- Coverage on the method level
These can also be combined with each other. At the class level we can define the coverage as follows:
    @Rule
    @ClassRule
    public static TestCoverageProcessEngineRule rule = TestCoverageProcessEngineRuleBuilder.create()
            .excludeProcessDefinitionKeys(DELIVERY_PROCESS_KEY)
            .assertClassCoverageAtLeast(0.9)
            .build();
Requiring test coverage of 1.0, meaning 100%, is not recommended either because of the previously mentioned bugs. At the method level, we can add a coverage requirement as follows:
    @Test
    public void shouldExecuteHappyPath() {
        Scenario.run(testOrderProcess)
                .startByKey(PROCESS_KEY, withVariables(VAR_CUSTOMER, "john"))
                .execute();

        verify(testOrderProcess)
                .hasFinished(END_EVENT_ORDER_FULLFILLED);

        rule.addTestMethodCoverageAssertionMatcher("shouldExecuteHappyPath", greaterThanOrEqualTo(0.5));
    }
There are several org.hamcrest.Matchers available, for this use case the following are helpful:
greaterThangreaterThanOrEqualTolessThanlessThanOrEqualTo
The Camunda BPM Process Test Coverage offers a few more features, like switching off the coverage on class or method level. It is worth to have a look at the GitHub repository.
Traceable test coverage
The graphical representation of the test coverage in the form of HTML files is sufficient for local development. However, there are specifically two areas where the library reaches its limits:
Traceability
Test coverage is a great metric if we measure it. But measuring it also means keeping track of historical data. It’s about making improvements or increasing transparency to provide motivation and traceability. Therefore, we need a solution to collect and graphically present the reports we create.
CI/CD Integration
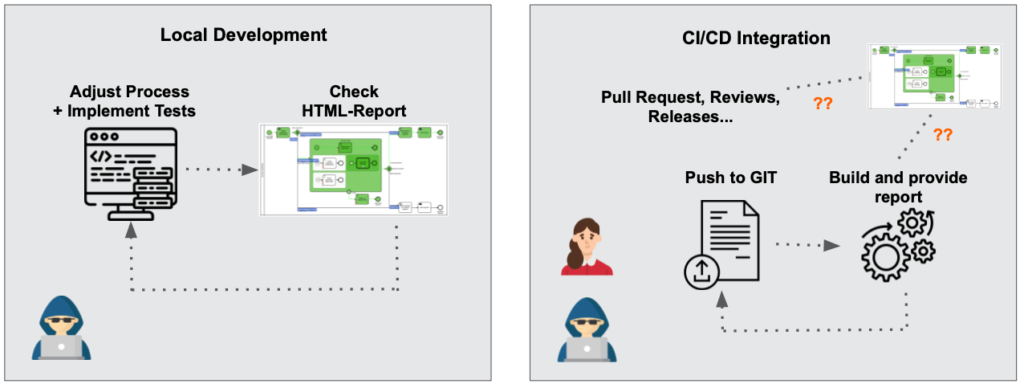
On the one hand, we have local development. After the process has been adapted, the corresponding test is implemented and executed, the test result is checked and then the whole process starts again. Once the model and test are completed, the corresponding code is pushed to Git.
The test is then run again in the build pipeline. But how are the results of a pull request, for example, visualized? How can a change in coverage compared to the previous state be tracked? With Camunda BPM Process Test Coverage this is not possible out-of-the-box.

These are just some of the reasons why we developed FlowCov – a platform that covers precisely these requirements. It enables you to upload the generated reports as part of your own build pipeline in order to process them graphically and make them accessible to all stakeholders. If you want to learn more about it, we recommend our Docs.
Further development
At the moment the Camunda BPM Process Test Coverage is being completely re-developed. Thus various enhancements and features will be implemented:
- Compatibility with JUnit5
- Splitting up coverage measurement and report generation
- Redesign of the local HTML report
- Seamless integration in FlowCov (without custom extension)
- Possible usage for integration tests
If you want to participate and bring in your own ideas, we would be happy to receive contributions and discussions! The development takes place in this Camunda Community Hub fork.
If you’d like to dive deeper into testing topics, check out Testing Cheesecake – Integrate Your Test Reports Easily with FlowCov, presented at CamundaCon LIVE 2020.2 and available free on-demand.
Dominik Horn is Co-Founder of Miragon — specialists in process automation and individual software development. Stay in touch with Miragon on Twitter or GitHub.

Camunda Developer Community
Join Camunda’s global community of developers sharing code, advice, and meaningful experiences


