Key performance indicators (KPIs) are the most important metric for analyzing statistical data of business processes: KPIs can not only be used to highlight efficiencies and inefficiencies in business processes, but they can help to subsequently improve specific activities in order to speed up process execution. Choosing the right KPIs and displaying the data in a simple and intuitive way is key for process improvement.
One of the most common requirements for KPI monitoring is about time-sensitive business processes. The question that you might ask is ‘How can we monitor which business processes or specific steps were completed in time and which did not?’
Within this blog entry I will outline how one can make use of Camunda’s open architecture to implement such requirement in a custom-tailored way: On the one hand I will show how you can make use of the Camunda Modeler to define the acceptable cycle time threshold for a process and its steps. On the other hand, I will provide an example for a Camunda Cockpit Plugin which can be used for monitoring this KPI within the Camunda Cockpit.
Walkthrough
Invoice Showcase
Let’s have a look on the following typical Invoice Receipt process:
Within this process the team assistant, an approver and an accountant are working on a number of human tasks. You can imagine that those tasks are time-sensitive and also that the process of invoice processing itself has to be finished within a specific time-frame. So let’s assume a company decided that they want every single invoice to be processed within e.g. five days and therefore every task has also specific pre-defined cycle times.
The process diagram itself has been modeled in Camunda Modeler using BPMN 2.0. In order to add KPI information in a standard-compliant way to a BPMN 2.0 diagram you can make use of the open architecture of the Camunda Modeler.
Adding KPI information in Camunda Modeler
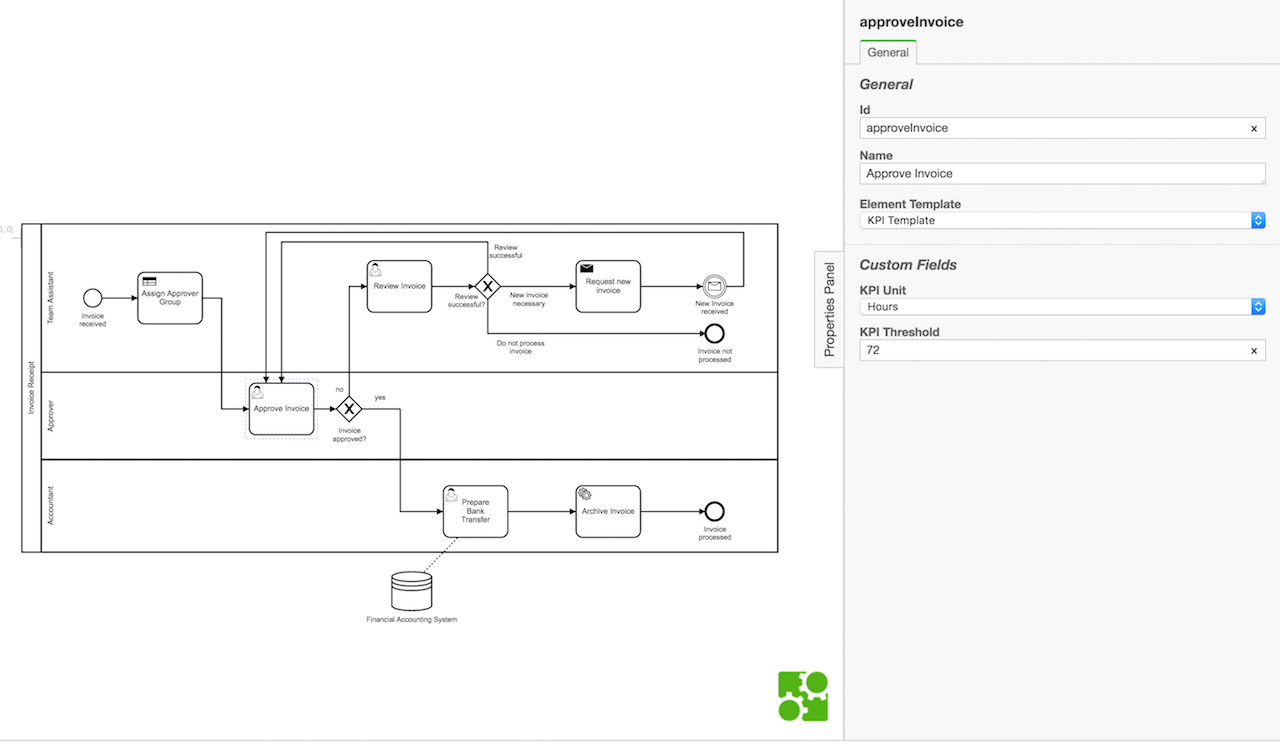
Since Camunda Modeler 1.0 element templates help developers to extend the Camunda Modeler in a very easy way (see Element Template Docs). In order to add KPI information to a BPMN process model I created a short element template in the JSON-configuration file that allows to add KPI information within the properties panel of Camunda Modeler.
[
  {
    "name": "KPI Template",
    "id": "kpi",
    "appliesTo": [
      "bpmn:Collaboration","bpmn:Process","bpmn:Task","bpmn:IntermediateCatchEvent"
    ],
    "properties": [
      {
        "label": "KPI Unit",
        "type": "Dropdown",
        "value": "ms",
        "choices": [
          {"name": "Milliseconds", "value": "ms"},
          {"name": "Seconds", "value": "s"},
          {"name": "Minutes", "value": "m"},
          {"name": "Hours", "value": "h"}
        ],
        "editable": true,
        "binding": {"type": "camunda:property","name": "kpiunit"}
      },
      {
        "label": "KPI Threshold",
        "type": "String",
        "value": "",
        "editable": true,
        "binding": {"type":"camunda:property","name":"kpi"}
      }
    ]
  }
]
With the help of this element template it is now very easy (also for business users) to add the KPI information into the following BPMN elements:
- Process
- Collaboration / Pool
- Task
- Catching Intermediate Event
The following screenshot shows how the extended properties panel looks in the Camunda Modeler for tasks (in this example the approveInvoice task):

On a technical level the KPI-information that is added here will be saved in a BPMN extension element, which can be seen in the following XML:
<userTask id="approveInvoice" name="Approve Invoice" camunda:formKey="embedded:app:forms/approve-invoice.html" camunda:modelerTemplate="kpi">
  <documentation>Approve the invoice (or not).</documentation>
  <extensionElements>
    <camunda:properties>
      <camunda:property name="kpiunit" value="h" />
      <camunda:property name="kpi" value="72" />
    </camunda:properties>
  </extensionElements>
  <incoming>sequenceFlow_178</incoming>
  <incoming>reviewSuccessful</incoming>
  <incoming>SequenceFlow_1b868h0</incoming>
  <outgoing>sequenceFlow_180</outgoing>
</userTask>
But how can we now use these KPIs to monitor this process- and its process-instances in Camunda?
Using Cockpit Plugin to monitor KPIs
The right place to do this is the Camunda Cockpit that offers a number of plugin points by which it can be extended in a developer friendly way using your own Camunda Cockpit Plugin.
For displaying the KPI information I made use of two different plugin points as the intention was to give the user the possibility to track KPI information on a process definition and process instance level. From a technical point of view most parts of the Plugin consist of basic JavaScript code which is used to communicate with Camunda’s REST API and displaying the received data in the Front-End. The only Java Code that was used is responsible for aggregating data regarding all process instances which is just way faster and easier when doing it directly with SQL and Java than calculating it in the Front-End.
Process Definition KPI Overview
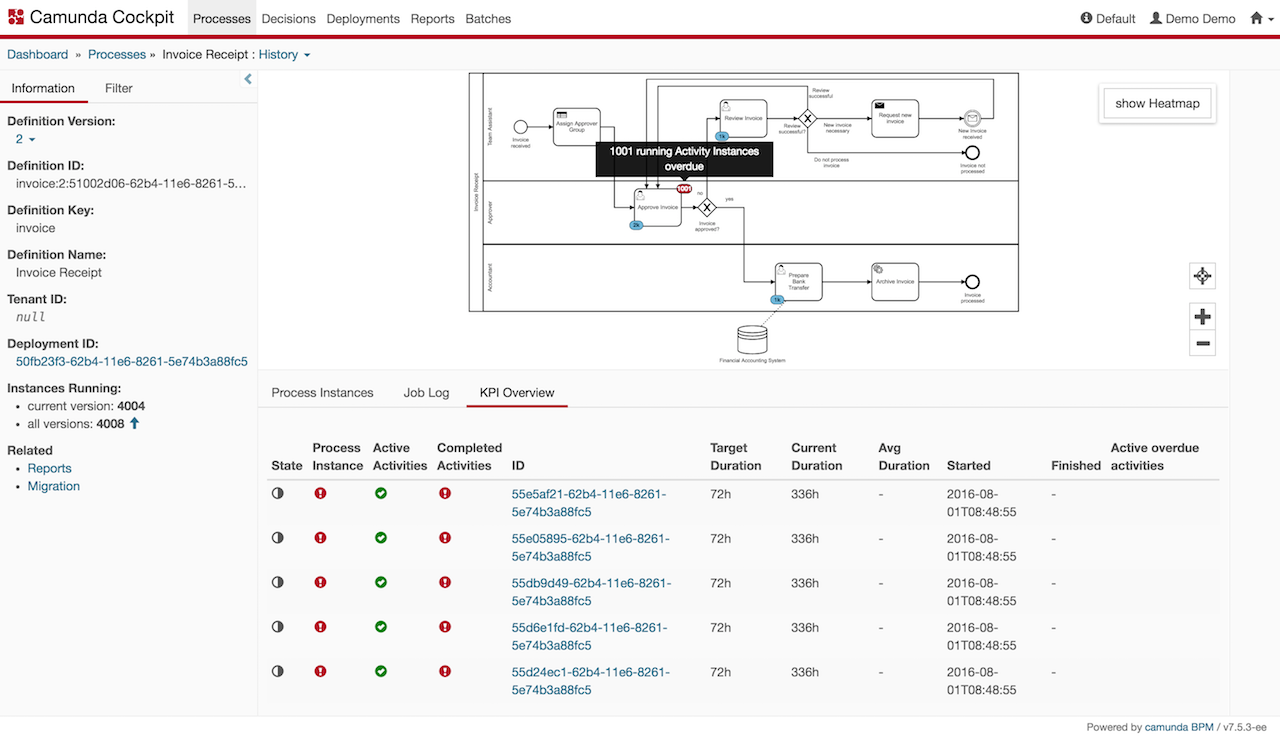
The first view in which I integrated the KPI monitoring plugin is the process definition history tab. From a technical perspective this plugin point is called ‘cockpit.processDefinition.history.tab’ and when using it a new tab below the process diagram is created on the Process Definition History page.
There you can quickly get an overview about which process instances are overdue and get a hint which activity slows down your process and is overdue often.

Within the table among other information three overdue states are provided to the user by which he can quickly get an overview at which process instances he has to look at during monitoring:
- process instance overdue state: calculated based on process duration and target duration defined on process / pool level
- active activity instances overdue state: calculated based on running activity instances and target duration defined per activity
- completed activity instances overdue state: calculated based on completed activity instances and target duration defined per activity
Additionally, I added a badge per activity on the process diagram that displays the amount of running overdue activity instances. With the help of this information you can identify easily which activity has issues and needs direct attention.
Process Instance KPI Overview
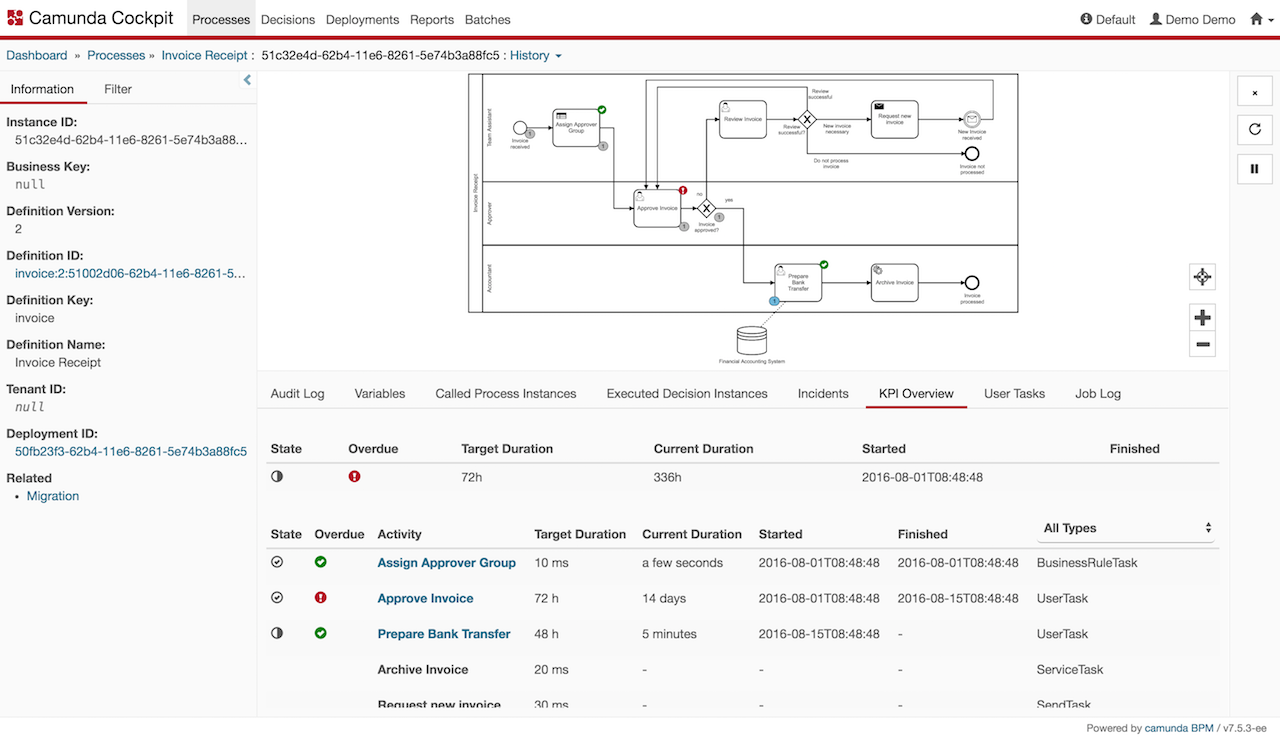
The second view in which I integrated the KPI monitoring plugin is the process instance history tab. From a technical point of view this plugin point is called ‘cockpit.processInstance.history.tab’ and when using it a new tab below the process diagram is created on the Process Instance History page.
Within this view the user can analyze the cycle times on activity level for a specific process instance.
The badges on the diagram give a quick overview about which tasks have been completed within the defined time and which tasks are currently overdue. Among other information within the table you can easily see which steps within the process instance are overdue and see the target and current duration of them.

How to use & where to get
Camunda Modeler Element template
The element template that I used can be found on GitHub using the following link:
[Element Template GitHub] (https://github.com/camunda/camunda-consulting/tree/master/snippets/camunda-kpi-monitoring-demo/element-template)
On GitHub you will also find specific information on where you have to place this configuration file to make it work with the Camunda Modeler on your machine.
Besides just using this configuration file, you can also customize it to your needs which means that you can add other KPIs that are relevant for your business process in an easy way.
Camunda Cockpit Plugin
The Camunda Cockpit Plugin can also be found on GitHub using the following link:
Camunda Cockpit Plugin GitHub
On GitHub you will also find specific information on how to deploy this plugin to your Camunda Cockpit. You can clone this plugin and deploy it using maven or ant. If you added more KPIs to the element template you might want to add these KPIs within the JavaScript code and HTML file so that they are displayed in the Cockpit.
Summary & Outlook
This blogpost showed how straightforward it is to extend the Camunda Modeler and the Camunda Cockpit to define and monitor KPIs for business processes thanks to Camunda’s open architecture. As a starting point this example used the cycle time of process instances and specific activity instances to show how KPIs can be monitored within Camunda. This KPI is only used as an example and you certainly can imagine a way broader set of KPIs that could easily be setup based on the given element template and the Camunda Cockpit plugin.
What one could imagine to add in the future is a possibility to filter short-term and long-term KPIs so that we look only at a smaller set of process instances when calculating e.g. averages.
A further idea could be to add a notification functionality so that task assignees are automatically notified when a specific task is overdue.
Contribute
Contributions in the form of code, bug reports and feature ideas are very welcome and can be made directly in the camunda-kpi-monitoring-demo repository on GitHub.
If you would like to get more hands-on information and see the source code, you can also join the upcoming Webinar about [KPI Monitoring] (https://network.camunda.org/webinars/81).
Getting Started
Getting started on Camunda is easy thanks to our robust documentation and tutorials
