In the past few weeks, we’ve mentioned Zeebe’s performance in horizontal scalability benchmarks that we run internally, but we haven’t yet explained how exactly we run these benchmarks. We decided we should take it one step further and open up the benchmark to anyone who wants to try it.
We wrote this post to:
- Briefly review how Zeebe provides horizontal scalability and fault tolerance
- Describe one of the benchmarks that we run internally to measure Zeebe’s scalability and share our results (spoiler: Zeebe scales, again)
- Provide code and a README so that you can replicate these benchmarks yourself by running a Zeebe cluster on AWS
A big thanks to Felix for setting up the benchmark repository and running the benchmarks for this post.
Please note that this benchmark post captures a “point in time” (one version of Zeebe, one specific metric tracked), and the blog post will not be updated on an ongoing basis. We do think it could be valuable to maintain a “benchmark testbed” that measures performance of a few representative use cases and is updated over time, and we’re interested in user feedback on what would be most helpful to see here.
How Zeebe Scales and Provides Fault Tolerance
As a workflow engine for microservices orchestration, it’s critical that Zeebe can scale to handle high-throughput workloads. The use cases we had in mind when we designed Zeebe might require the execution of hundreds of thousands (or more) workflow instances per second, and so the ability to scale horizontally on commodity hardware is a defining characteristic of Zeebe.
With these scalability requirements in mind, let’s go through a surface-level explanation of the mechanisms that allow Zeebe to scale horizontally and in a fault-tolerant manner.
First, Zeebe does not rely on an external database for data storage–this is one attribute that makes it different from other workflow engines. Most, if not all, workflow engines rely on relational databases to maintain state–that is, the current status of in-flight workflow instances and relevant metadata about these instances. Reading from and writing to a relational database will, at some point, become a significant performance bottleneck.
So if Zeebe doesn’t use a relational database, how does it maintain state?
In Zeebe, data is persisted on the same servers (“brokers”) where Zeebe is deployed. The data is stored as a stream of workflow-related events in the form of append-only logs (“topics”). Sequential writes to a log are much more efficient than updates in a database and still provide Zeebe with the ability to derive the current state of a workflow at any point in time.
Zeebe’s mechanism for horizontal scalability is partitioning, which makes it possible to distribute data in a Zeebe topic across a cluster of machines (partitioning is similar to the concept of sharding in the database world). A Zeebe user configures the number of Partitions when creating a new topic.
Equally important to horizontal scalability in Zeebe is fault tolerance, meaning that if a Zeebe broker goes down, no data will be lost, and the microservices or other workers that publish events to and consume events from Zeebe are able to resume processing with minimal interruption.
To provide fault tolerance, Zeebe partitions can be replicated across different machines, and this ReplicationFactor (the number of replications created per partition) is another configuration option that’s set by a user during topic creation.
Let’s visualize these concepts to make sure they’re clear. In the graphic below, we show a single Zeebe topic with two Partitions and a ReplicationFactor of three distributed across three Zeebe brokers. In this scenario, one of our Zeebe brokers could go down, and we’d still be able to continue processing with no data loss–the number of broker failures that can be tolerated is equal to ((ReplicationFactor – 1) / 2).

To summarize:
- To scale throughput, you can increase the number of
Partitionsto distribute processing over machines in a cluster - For fault tolerance, you can configure the
ReplicationFactor; replications function as “hot standby” of yourPartitionsthat are stored on different brokers, making it possible to quickly resume processing after a failure
For more information about these concepts, we recommend the Topics & Partitions entry in the Zeebe docs.
It’s very easy for a user to configure Partitions and ReplicationFactor, and you can go through the topic creation process using the Zeebe CLI in the Zeebe Quickstart. Here’s how we’d create a new topic and configure Partitions and ReplicationFactorto match our example above.
$ ./bin/zbctl create topic quickstart --partitions 2 --replicationFactor 3
{
  "Name": "quickstart",
  "State": "CREATING",
  "Partitions": 2,
  "ReplicationFactor": 3
}
Of course, ease of configuration doesn’t matter if these mechanisms don’t actually allow Zeebe to scale in a fault-tolerant manner, and so we regularly run benchmarks to understand how Partitions and ReplicationFactor impact Zeebe’s performance.
What metrics do we use when we benchmark Zeebe?
One metric that we focus on in our benchmarks is “workflow instances started per second”, and that’s the metric that we’ll explore more deeply today. Note that there are many other metrics that the Zeebe team pays attention to, but this particular metric is a useful measure of Zeebe’s horizontal scalability and the impact of fault tolerance on Zeebe throughput.
We’ve already used this phrase “workflow instances” once in this post, and before we continue, we want to be sure this definition is clear.
As a workflow engine, Zeebe sees the world in terms of workflows, or in other words, a sequence of events that allow us to achieve some result. An e-commerce company might have an “order” workflow that’s defined like this, where each task in the workflow is handled by a different microservice:

A “workflow instance” is one specific occurrence of a workflow. In the e-commerce example, this refers to one specific customer order. So our metric “workflow instances started per second” would represent to “the number of new customer orders that Zeebe starts processing per second”.
End-to-end workflow metrics (such as average time per completed workflow instance or average time required for a certain task in a workflow) are also interesting, but these metrics are difficult to compare across different use cases. The duration of a task within a workflow heavily depends on the business logic or external services that we call in the task.
Zeebe will certainly provide users with the tools necessary to analyze and improve end-to-end workflow performance–for example, in the Zeebe 0.10.0 release, we added timestamps to all records to enable reporting on workflow instance and task duration–but when comparing entirely different use cases, end-to-end workflow metrics aren’t the best choice for an objective measure of Zeebe’s horizontal scalability because of the diverse business logic inside workflow tasks.
What’s our benchmarking environment?
To make our benchmarks easily reproducible, we use:
- AWS EC2 T2.2Xlarge instances (note that our only consideration when choosing an instance type for the benchmark was to use general-purpose, commodity hardware available to anyone with an AWS account, and this shouldn’t be interpreted as the instance type we recommend for maximizing Zeebe performance)
- Terraform to spawn the AWS infrastructure
- Ansible scripts to install the necessary tools and software for Zeebe clients and the Zeebe cluster in a consistent manner
- Open-source tools such as Prometheus and Grafana for metrics collection and visualization
Our Ansible scripts first create a broker for setting up our cluster, and once the cluster is in place, we deploy the BPMN process. Next, we define a topic, including Partitions and ReplicationFactor, and then we start the client.
The client’s role in the benchmark is to create new workflow instances as quickly as possible and push these to the broker.
Later in this post, we’ll point you to a public repository with everything you need to replicate this setup and try it yourself.
Measuring scalability: Zeebe’s benchmark results
Next, we’ll summarize the results of benchmarks that we ran with 2 different Partitions and ReplicationFactor configurations.
Single topic, ReplicationFactor = 1
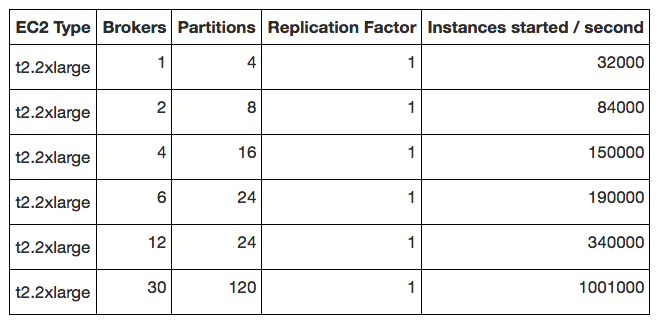
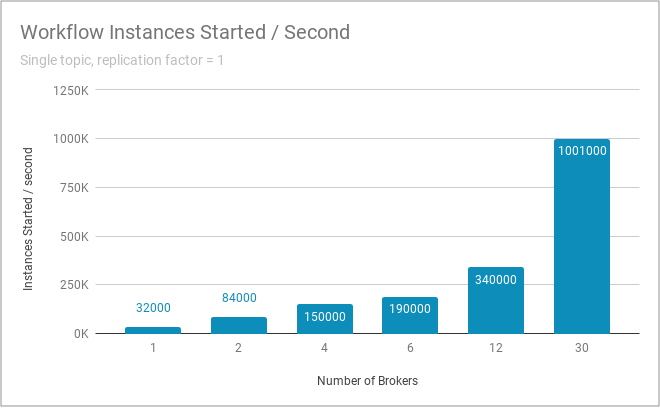
The table and graph below show benchmark results when running Zeebe with a single topic and a ReplicationFactor of 1. The trend that’s most interesting is workflow instances started per second as we increase the number of Partitions. That’s what we’ve captured in the graph below.
To highlight: with 120 partitions running on 30 brokers, Zeebe exceeds 1 million workflow instances started per second.


Single topic, ReplicationFactor = 3
But running Zeebe with a ReplicationFactor of 1 isn’t realistic for a production environment. If a Zeebe broker with unreplicated partitions were to go down, data would be lost–this single-replication configuration is not fault tolerant.
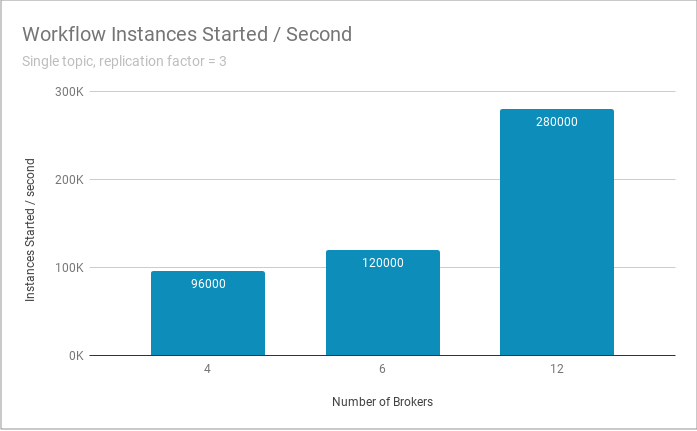
And so we also ran the benchmark with a ReplicationFactor of 3. Overall, we see the same pattern of throughput scalability as we increase the number of brokers and partitions.


To understand the impact of an increased ReplicationFactor on performance, let’s focus on results from each test with the same broker / partition configuration (12 brokers, 24 partitions).

- With a
ReplicationFactorof 1, Zeebe starts 340,000 workflow instances per second. - With a
ReplicationFactorof 3, Zeebe starts 280,000 workflow instances per second.
In other words, Zeebe’s throughput decreases by about 18% when changing the ReplicationFactor from 1 to 3 under this specific set of benchmark conditions. We expect throughput to decrease when we use a higher ReplicationFactor because Zeebe has more work to do: it must create copies of each partition on other brokers then wait for confirmation that the replication was successful to reach a quorum.
Of course, whether you consider these benchmark results to be “good”, “bad”, or “something in between” will depend on your throughput requirements. We can say that based on our knowledge of the use cases that Zeebe was designed to solve, we’re very happy with these numbers, and we’re optimistic that Zeebe will scale to handle just about anything a user can throw at it.
We should also give these benchmark results a point of reference. Based on our experience with workflow engines that do have a relational database dependency, we see that in a similar benchmark scenario, it’s possible to scale up to hundreds of workflow instances started per second (vs. hundreds of thousands in Zeebe). Granted, these workflow engines were designed with a different set of use cases in mind and solve them very well.
But hopefully, this delta helps to illustrate why we set out to build Zeebe and why we took a different architectural approach.
Run a Zeebe cluster on AWS and try the benchmark yourself
We want this benchmark to be easy for anyone to run so that it’s possible to measure Zeebe scalability in a hands-on manner and get a sense of how Zeebe might perform in a given use case. And so we published this repository that walks through the benchmark setup and provides all of the scripts we use to start the benchmark and measure the results.
More broadly, we hope this repo gives you some insight into how to run Zeebe on a cluster on standard hardware.
If you have any questions about the repo or the benchmark, please let us know via the Zeebe forum. This channel is monitored actively by the Zeebe team and is the best place to strike up a conversation about Zeebe.
Wrapping Up
We hope that you finished this post with a basic understanding of what makes Zeebe scalable and fault tolerant and a better sense of how you can measure Zeebe’s performance.
We also want to call out that there are some topics we didn’t cover in this post but might explain in more detail in the future, such as:
- Best practices for configuring
PartitionsandReplicationFactorbased on use case, throughput and resilience requirements, and available hardware - A deep dive into Zeebe internals, looking under the hood at how Zeebe provides these scalability and fault tolerance mechanisms
We’re always interested in hearing what topics the community would like us to write about, so please get in touch with any suggestions.
In the meanwhile, we encourage you to get a Zeebe cluster up and running on AWS and to try the benchmark yourself.
