We are happy to announce the release of Camunda Optimize version 2.4.0-alpha2.
You can find many improvements and features from the upcoming Optimize version 2.4.0 in this second alpha release, including:
- DMN Reports
- User Task Reports
- Instance State Filter Enhancements
- Notifications
- Clustering
The complete release notes are available in Jira.
You can try out a free trial of Camunda Optimize.
DMN Reports
In Optimize 2.3, we introduced the first-ever report for DMN: The raw data report. In 2.4.0-alpha2, we’ve added many new report types for decisions. In your reports, you can now select the evaluation count view. In combination with new “group by” options, this allows you to see how often a decision was evaluated, how the frequency of evaluations changed over time, or how evaluations are distributed over different input and output variables.
This information can then be visualized with the charts you already know from process reports. You can also set goals, configure the chart colors, and define axis names.
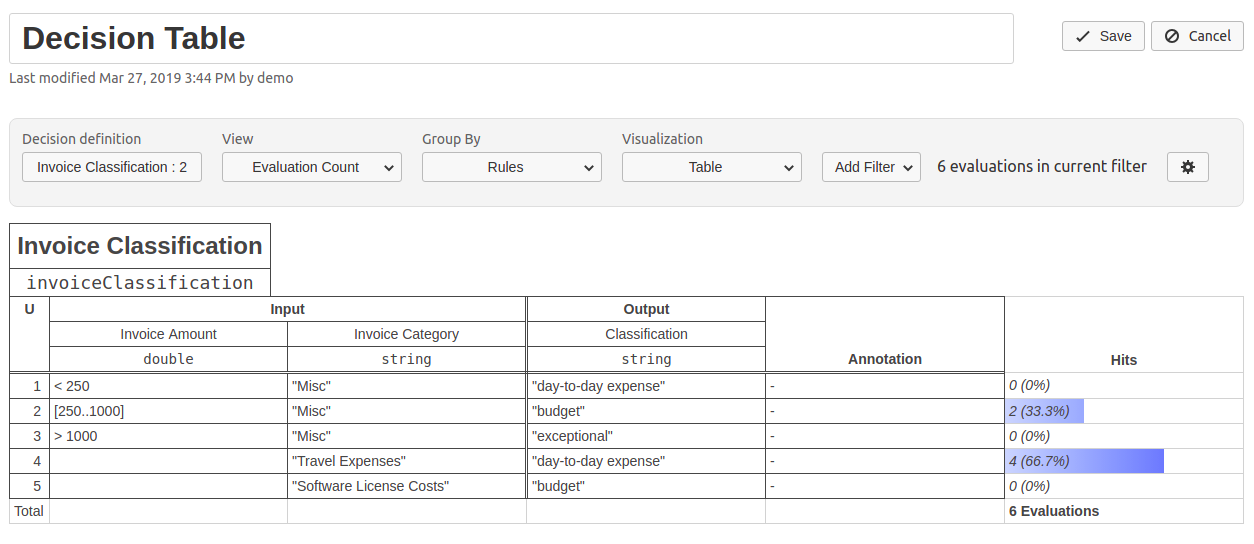
We also added a completely new visualization in the form of a DMN table. If you select rules as the grouping criterion, you will see the decision table as you would see it in the Camunda Modeler, but with an additional column showing you how often the rule hit.
All of these reports are of course combinable with filters, which gives you maximum flexibility for creating the report you need.
These new decision report types finally allow users to analyze and improve decision tables in the same way that’s possible for processes, broadening the scope of Camunda Optimize in a meaningful way.

User Task Reports
Since the inception of Camunda Optimize, users have been able to see the duration of flow nodes. User tasks in particular contain lots of additional valuable information, too. With this release, we’ve added the option to create reports not only for the total duration of user tasks, but also have a look at their work and idle time separately.
The idle time of a user task is the time it took until someone was assigned to work on the task after it was created. The work time is the time it then took until the task was completed.
You can find the new feature in the view options for process reports.

Instance State Filter Enhancement
In addition to all of Optimize’s process instance filters, we now introduce the Non-Canceled Instances Filter. Applying this filter will make Optimize query only those instances that were not canceled during execution. This means that only active and completed instances are considered. Externally or internally terminated instances are not included in the report. You can combine this new filter with a Completed Instances Filter to see only instances that were successfully completed–otherwise, the Completed Instances Filter includes canceled instances as well. The Non-Canceled Instances filter can also be combined with the duration filter to filter only successfully completed instances by duration, for example.
Notifications
This release includes a new notification feature in Optimize. Notifications provide timely information about the status of the application and give you direct feedback of the result of actions that were taken.
Here are some of the cases where a notification appears:
- Failure to save a report or dashboard
- Session timeout
- Logout failure
Notifications appear at the top center of the page. They appear in different styles depending on the type of the notification as shown in the image below.

Multiple notifications will be stacked on top of each other and will close automatically if the user does not interact with them.
Clustering
Last but not least, this release includes configuration parameters that allow you to seamlessly run multiple Optimize instances in a cluster setup.
An Optimize cluster can provide you the following advantages:
- Increase the availability of Optimize by scaling it horizontally (most commonly used for a failover setup)
- Setup dedicated importing and user-serving Optimize instances to increase responsiveness on high import loads
- In a multi-engine scenario, to distribute the import load over multiple Optimize instances
In a cluster, you need to configure one importing Optimize instance per connected Camunda BPM engine as well as a shared secret on instances that serve user requests. For a more details, please read the dedicated guide in our documentation.
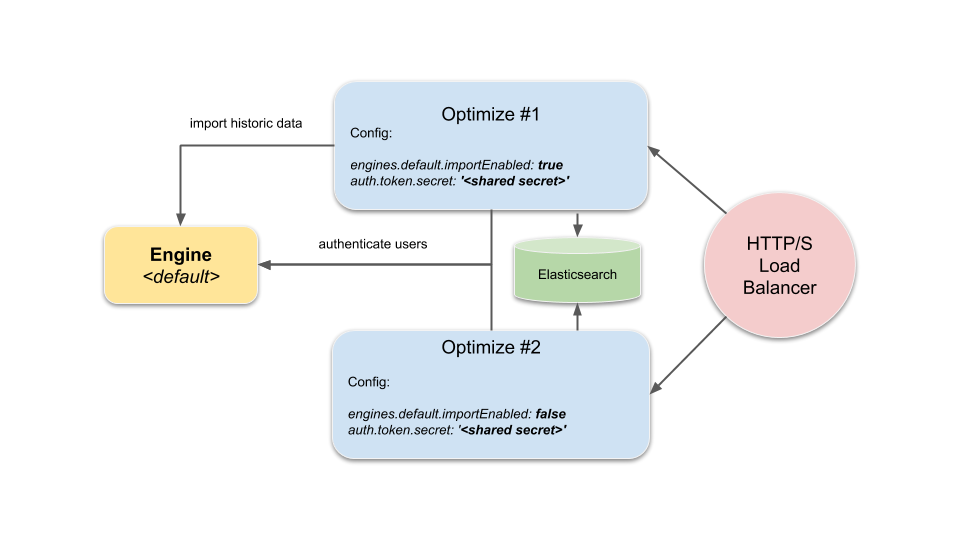
The following sample illustrates a simple failover cluster setup.

In this example, Optimize #1 acts as the actively-importing instance which also serves user requests if they are routed to it by the user facing load balancer. Optimize #2, on the other hand, is configured to not import data from the engine and thus solely handles user requests. If one instance is down, users will still be able to access Optimize as they are routed to the current available instance.
What’s Next?
After this alpha release, we’ll release the next minor Camunda Optimize 2.4 at the end of the first quarter 2019. Stay tuned for the release announcement.
How to get it
If you want to give the new Camunda Optimize a try, you can download the release with your Enterprise customer credentials. Please sign up for a free 30-day trial version.
Please note that alpha releases are not intended for production usage.
If you’re new to Optimize, we recommend that you watch the Getting Started with Optimize in less than 5 Minutes video.
