We’re excited to announce the release of Camunda Optimize 3.3.0.
Camunda Optimize supports continuous process and decision table improvement by providing transparency into your automated processes and decisions. Business-friendly reports and dashboards, as well as alerts, help you to identify process bottlenecks and improve your overall end-to-end process.
If you’d like to get started with Optimize 3.3.0 right away, you can download the release here with your Camunda Enterprise Platform customer credentials.
And if you’re not yet a Camunda customer, you can sign up here for a free 30-day trial of the Camunda Enterprise Platform, which includes Camunda Optimize.
In this post, we’ll highlight some of the new capabilities introduced in Optimize 3.3.0.
- Refreshed Report Builder and Reporting capabilities
- Process Analysis and Filtering improvements
- Flow Node Level Filters
- Incident Filters
- Custom Values in Variable Filters
- Flow Node by Variable Process Reports
- Full assignee and group names instead of technical IDs
- Dashboard Filter and Usability improvements
- Variable Filters allow viewers to add values
- Split Filter Report Filter and Dashboard Filters
- Edit Reports from Dashboard Edit Mode
- Moving Process and Decision Reports across environments
- External Process Events Inspection and Deletion
- Improved Updates and Maintenance
- Resumable Updates
- Updated Support for Elasticsearch
- How to get it
Refreshed Report Builder and Reporting capabilities
We are excited to announce our overhauled Report Builder, which speeds up and simplifies report creation significantly and allows for more use cases than before:
As you can see in the above video, we have moved our horizontal report builder into a sidebar design. From a structural point of view, the main changes you’ll see in this version are that the distributed by and aggregation options have moved from the configuration popover to the sidebar. Additionally, we moved the visualization selection more closely to the main chart area – out of the main report builder – and made sure that visualizations are visible as quickly as possible when selecting a view. Finally, the new sidebar offers new filters that apply on the Flow Node Level, allowing for more detailed process reports.
Existing report configurations and filters will be automatically migrated to the new structure when you update to Optimize 3.3.0.
Process Analysis and Filtering improvements
Besides the overhauled Report Builder, we added new reports and improved filtering capabilities.
Flow Node Level Filters
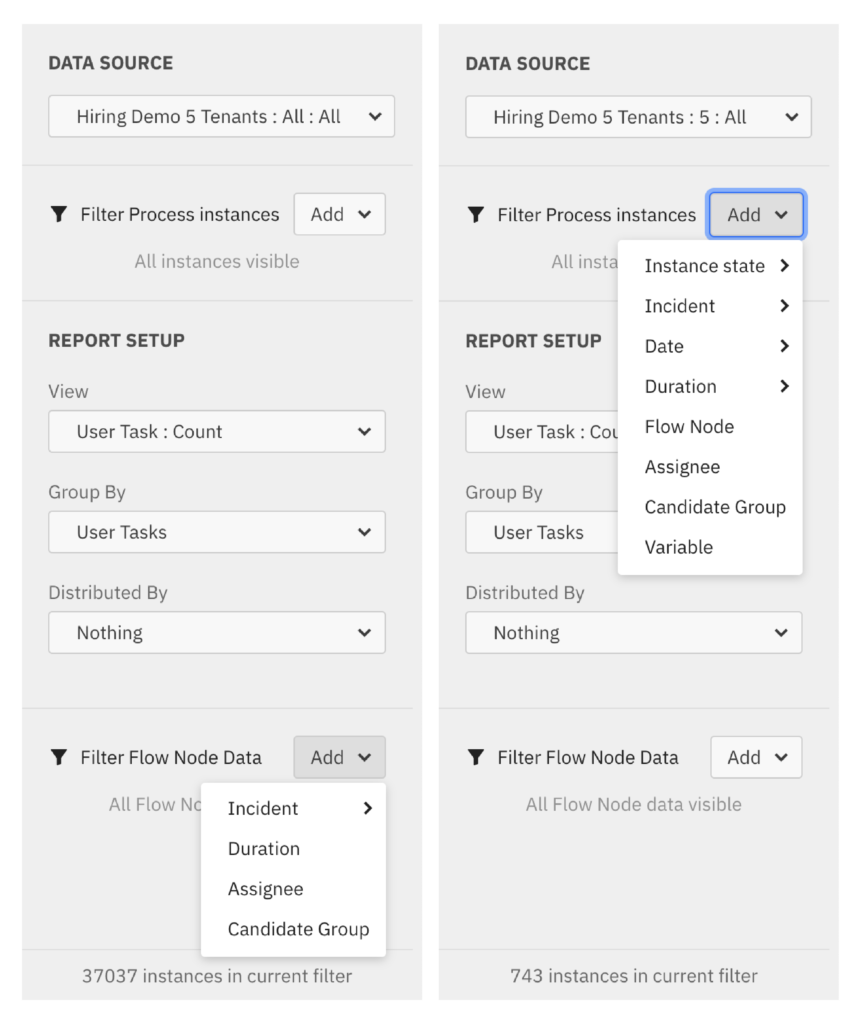
With this release we introduce a distinction between Process Instance Level Filters and Flow Node Level Filters:
Process Instance Level Filters return data from all full instances which met the filter requirement. For example, applying a process instance level assignee filter will return all instances where that assignee was involved, as well as displaying any other assignees and Flow Node types that appear in the instance.
The new Flow Node level filters enable returning data for specific Flow Nodes only. When applying a Flow Node level assignee filter, the returned data will only display the individual Flow Nodes where the assignee was present.
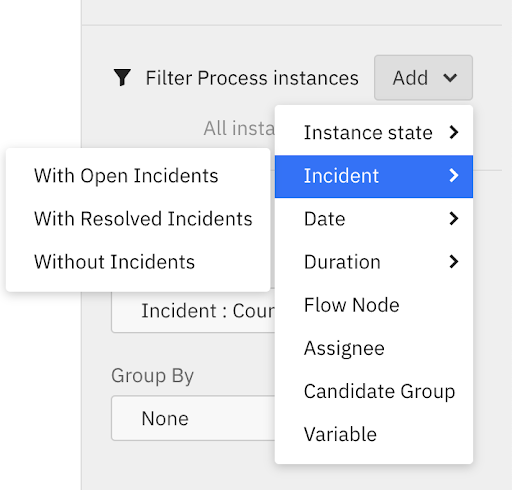
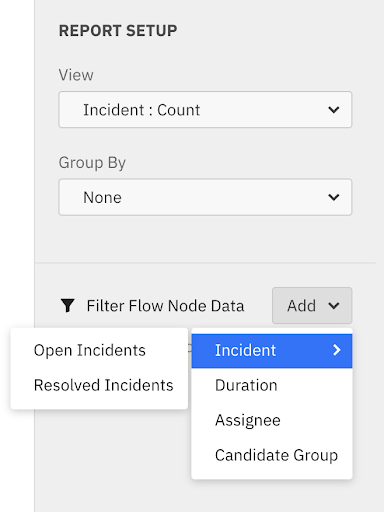
The following screenshots show all available process instance and Flow Node level filters in this version, with further additions planned in future releases:
Incident Filters
We’ve introduced two new ways of filtering for incidents:
Firstly, on the process instance level you can filter for process instances that have open incidents, resolved incidents or no incidents. This is particularly useful when looking at process instances that have no incidents since these can negatively impact performance – or at least distort the duration results.
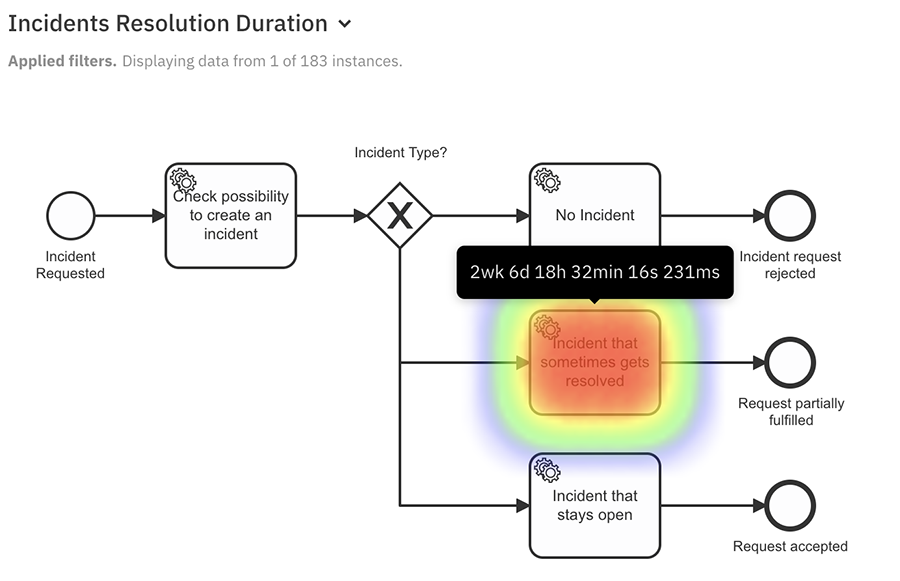
Secondly, on the flow node level you can filter for open or resolved incidents. This is particularly useful when looking at the number of open incidents per flow node or the duration of resolved incidents.
Custom Values in Variable Filters
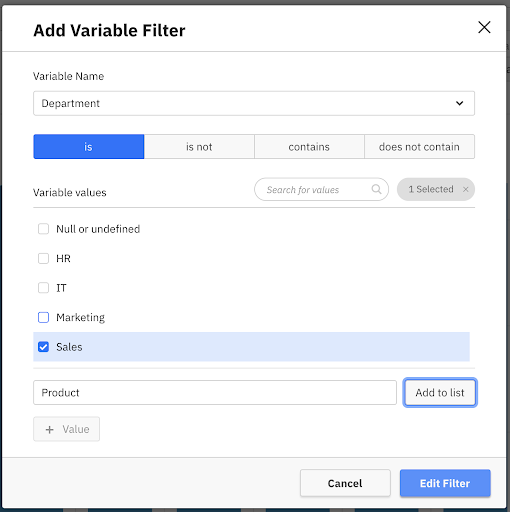
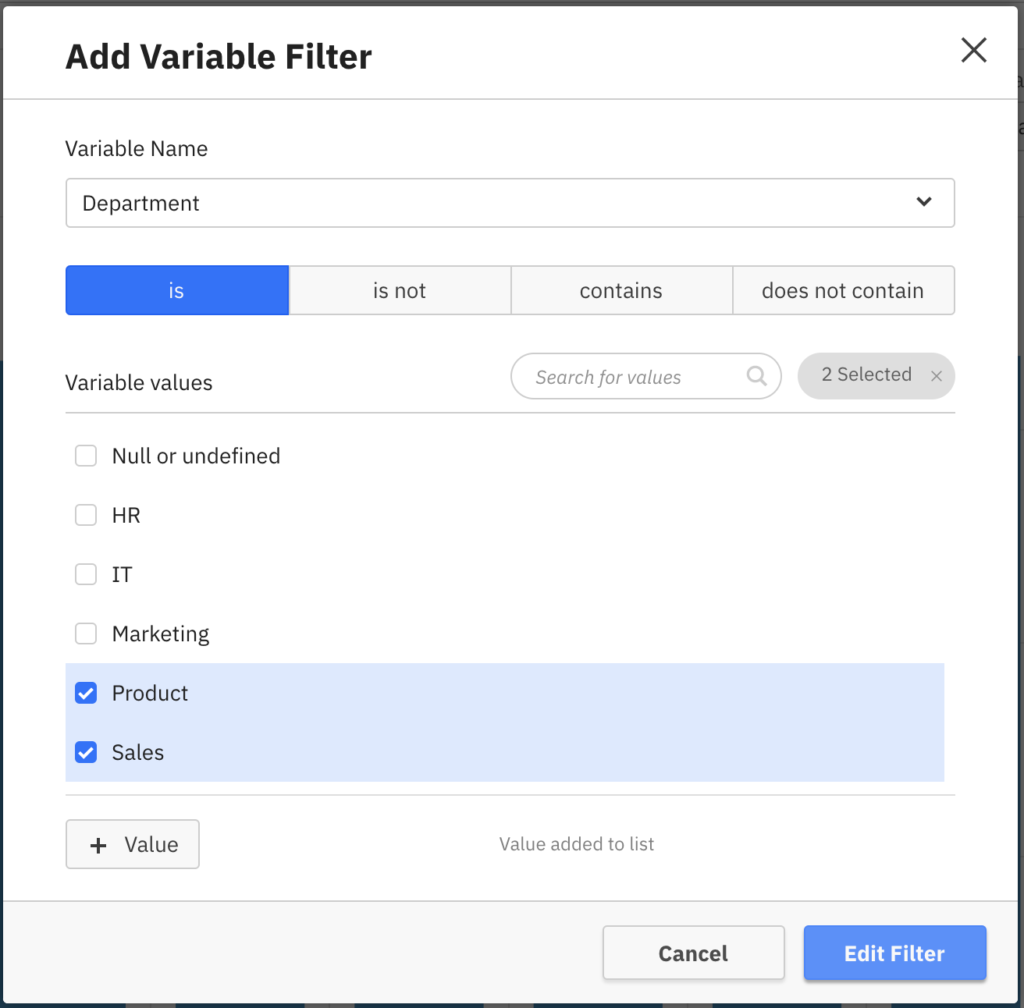
When using string variable filters, Optimize automatically populates a list of possible values that users can select from. In certain situations, you need to filter for values that do not yet exist in the process or decision data. This could be the case when report editors prepare reports for future usage and already know that these values will exist in future process instances.
Optimize 3.3.0 supports this scenario. Simply open a variable filter for a string variable and click on “+ Value” to enter your custom value. Afterwards, click on “Add to list,” as you can see in the following screenshots:
Flow Node by Variable Process Reports
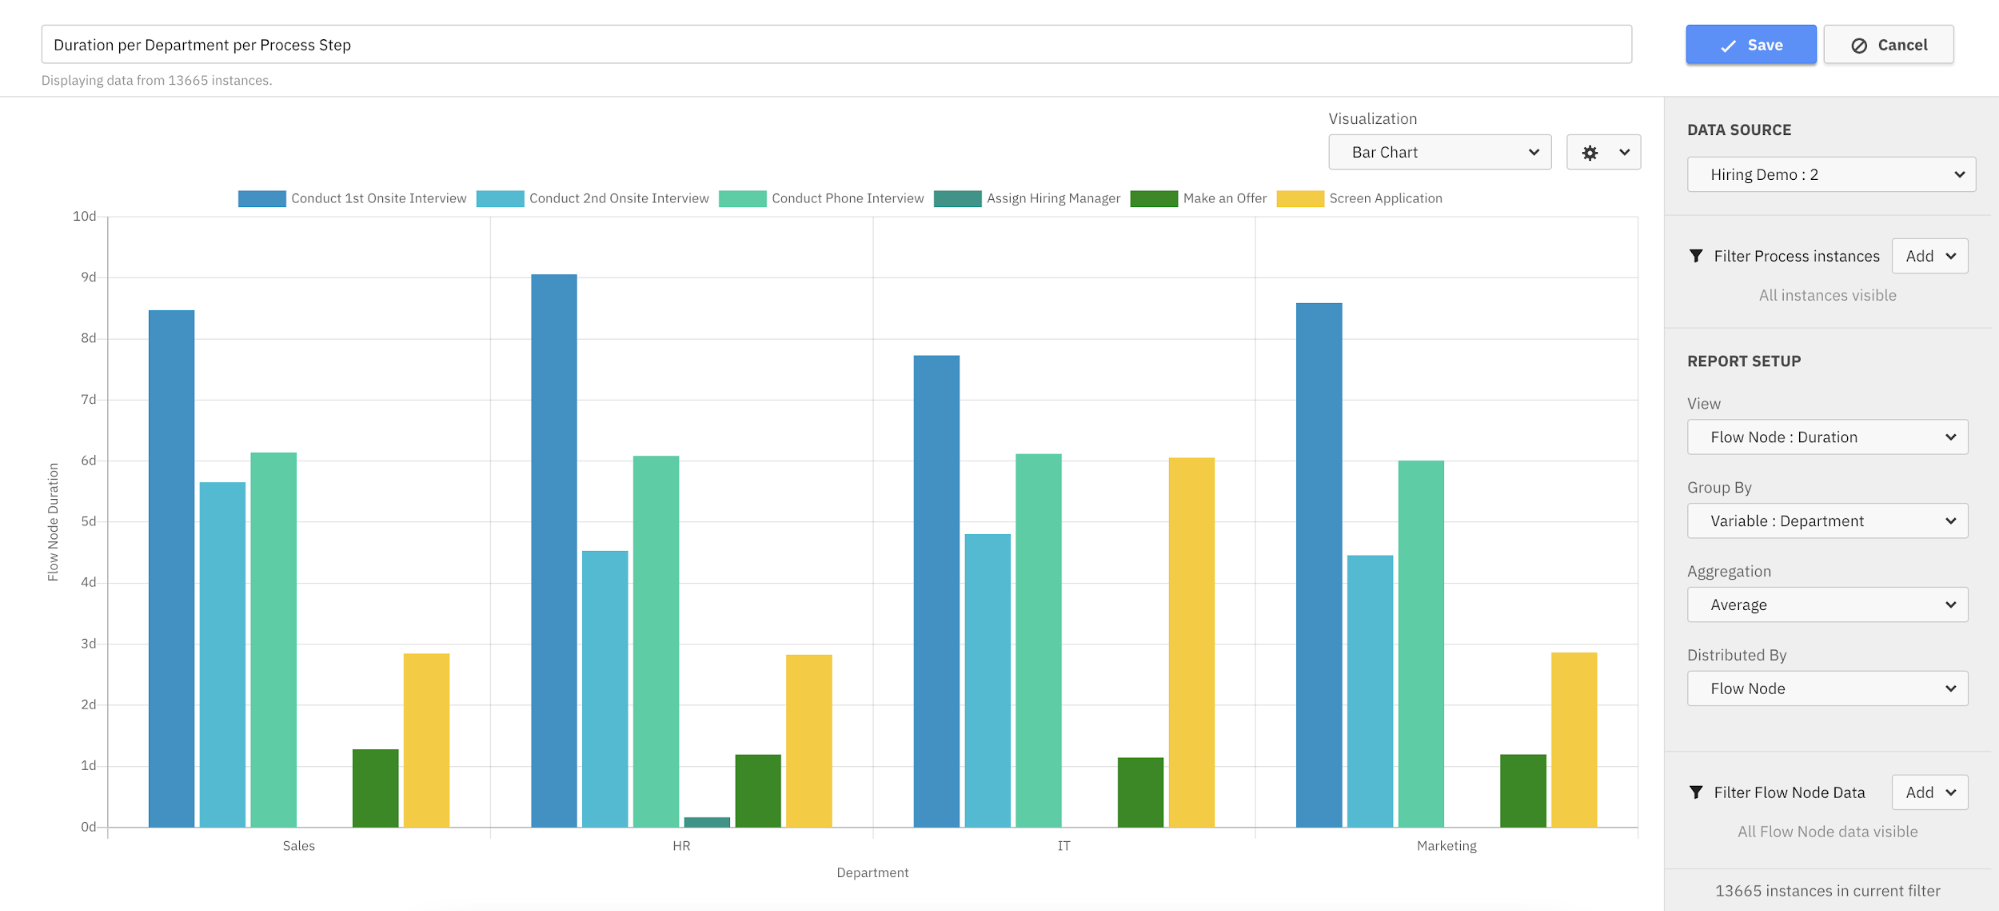
Flow Node performance is usually dependent on specific process context. In process automation projects, process variables are often key to differentiate between different contexts. Therefore, we are introducing a new type of process report which allows you to look at the duration or number of Flow Nodes (steps of the process) by a specific variable.
Simply create a new Process Report, select Flow Node Count or Duration and group by a Variable of your choice:
Full assignee and group names instead of technical IDs
When looking at User Tasks, Optimize now displays full assignee and group names instead of just technical user ids. The names that are displayed are automatically pulled from the identity service that is configured within your Camunda Engine, e.g. your third-party identity service via LDAP.
The full names are displayed in Reports and are also available within filters. This makes it much easier to filter process data for the correct candidate group or assignee.
User Metadata synchronization can be deactivated via configuration property ‘import.data.user-task-worker.metadata.includeUserMetaData’.
Dashboard Filter and Usability improvements
Besides Reporting and Filtering improvements, we have significantly improved Dashboard Filters as well as their usability.
Variable Filters allow viewers to add values
Dashboard Filters can be used to filter multiple reports simultaneously. We are improving Dashboard Variable Filters significantly by enabling dashboard editors to allow viewers to add filter values on their own.
By allowing dashboard viewers to filter on custom values, they gain a lot of flexibility and can consume dashboards for different scenarios without editors having to modify the filters.
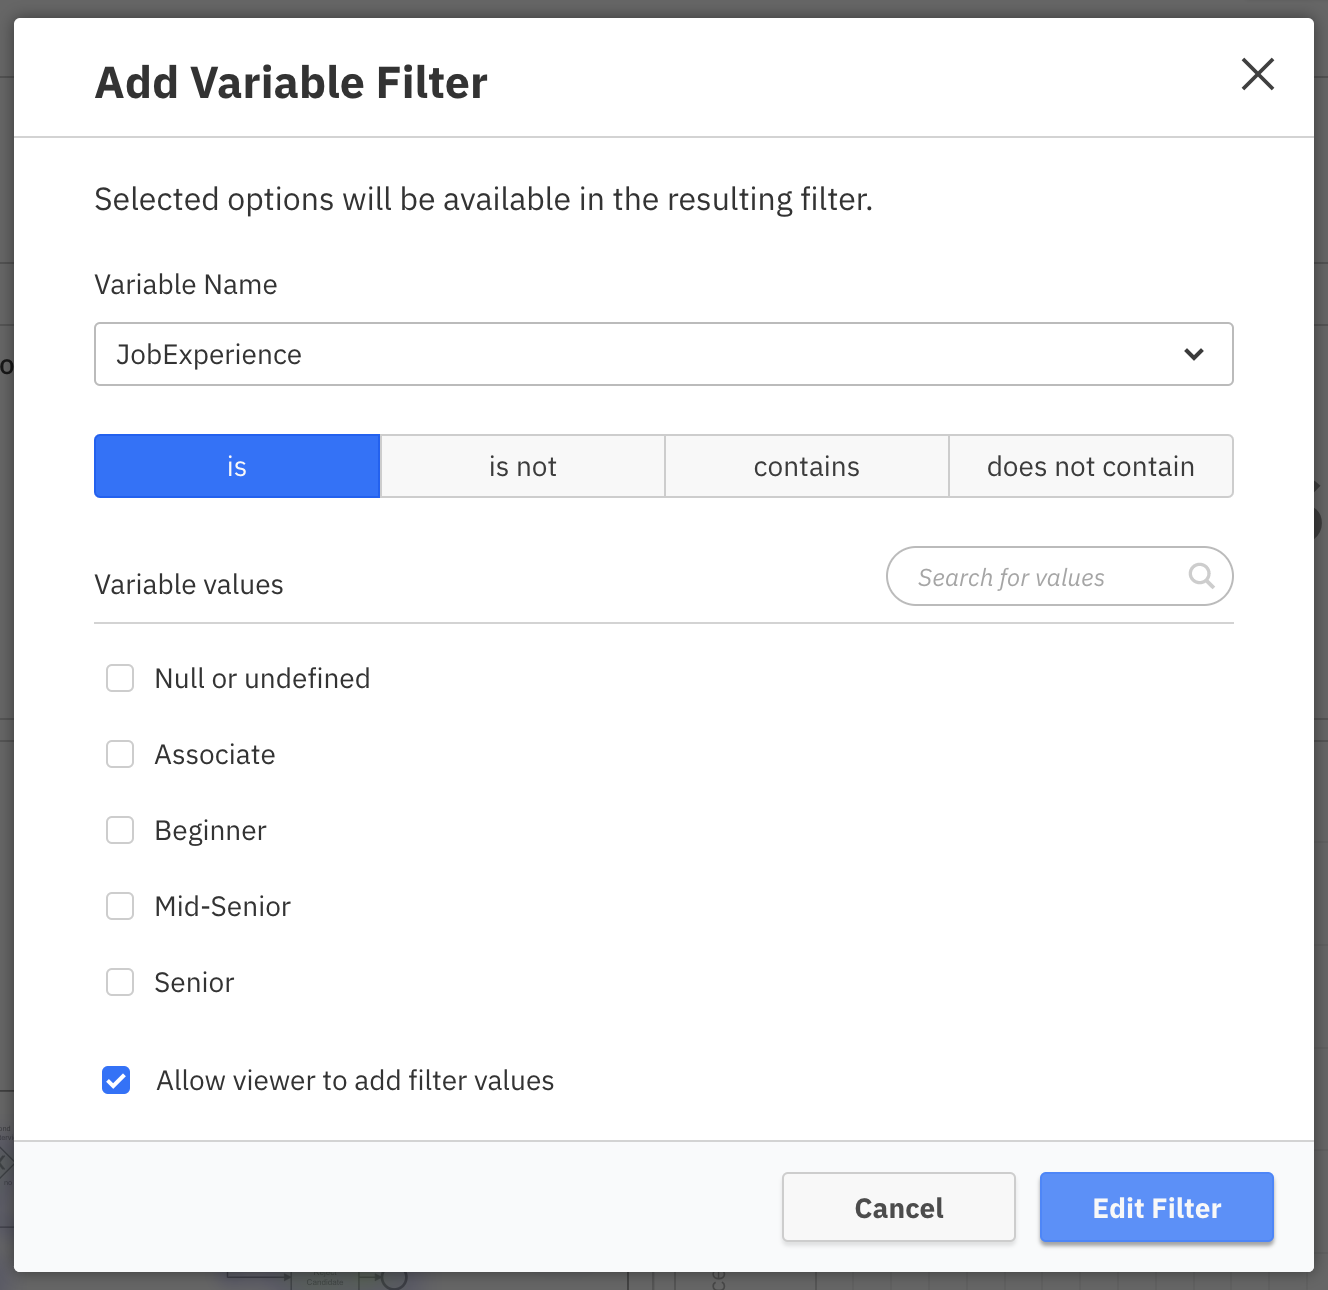
Editors can simply activate the checkbox “Allow viewer to add filter values” when adding a Variable Filter on a dashboard as shown below:
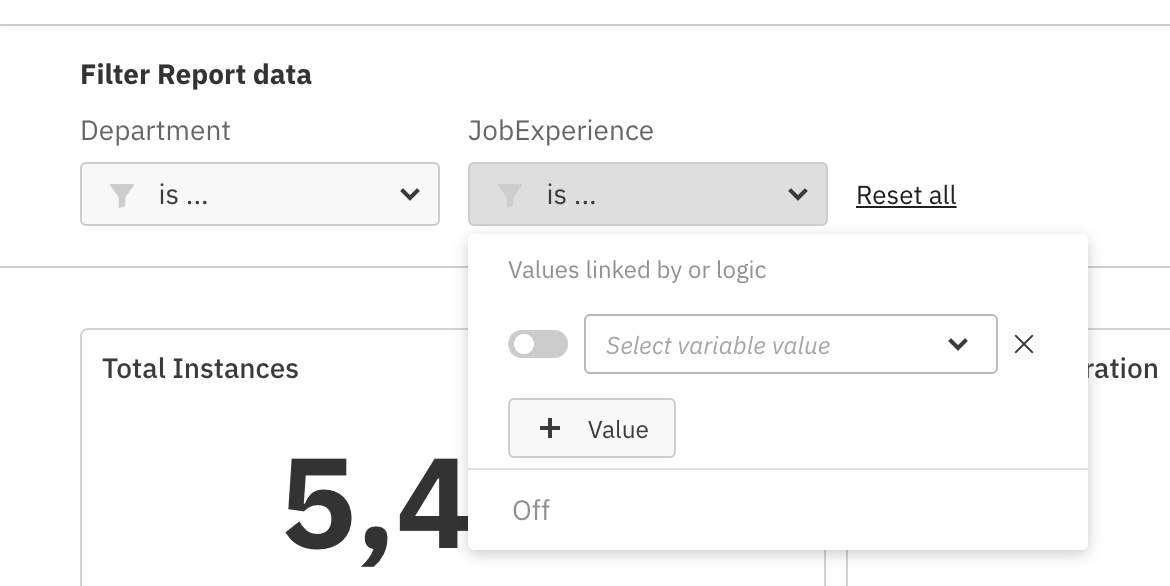
When the checkbox is activated, dashboard viewers will see a Typeahead in the Dashboard Filter that can be used to filter for any value that is available for the chosen variable:
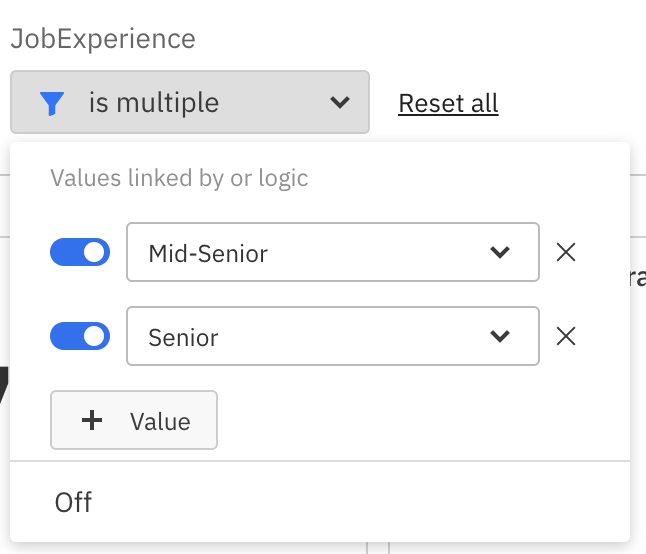
Dashboard viewers can even link multiple values by ‘or’ as you can see in the following screenshot:
Split Filter Report Filter and Dashboard Filters
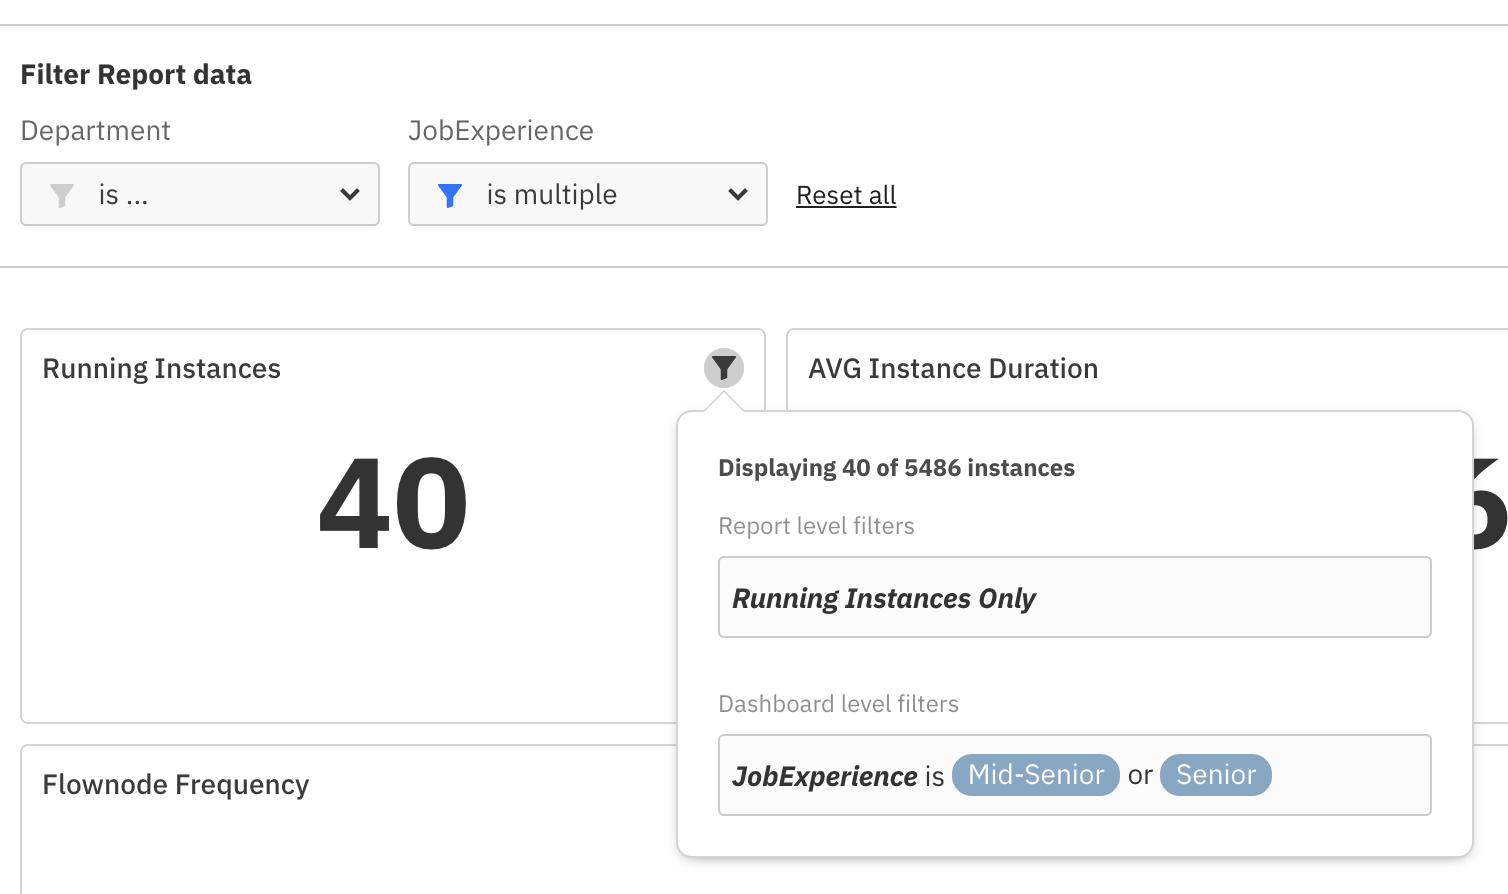
Dashboard filters can be applied on top of filters specified in Reports. In order to make it easier to see which filters apply once a Dashboard Filter has been activated, we’ve split the applied Filters into a report and a dashboard section as shown below:
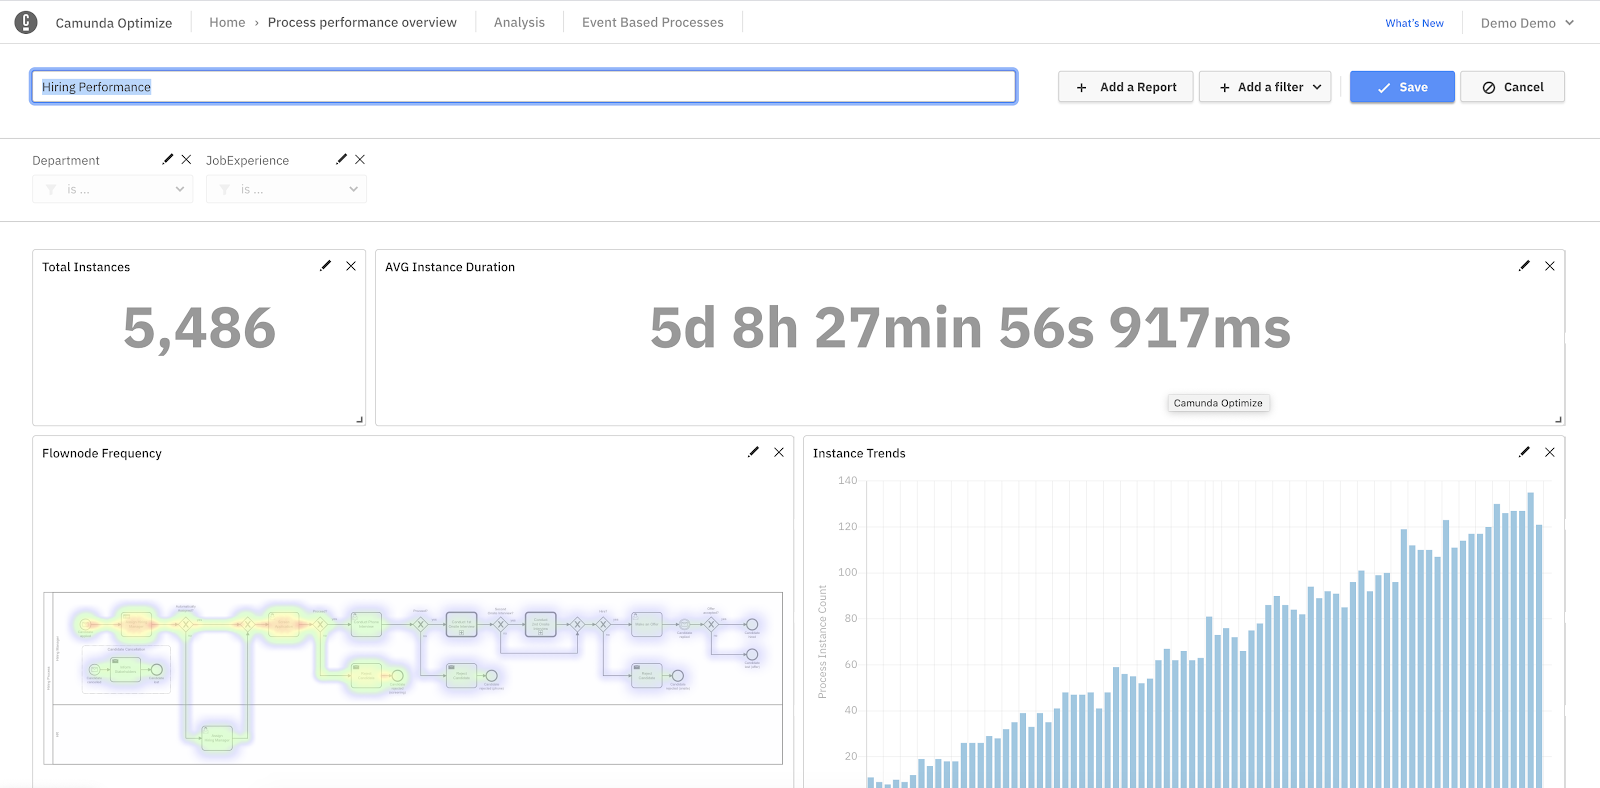
Edit Reports from Dashboard Edit Mode
When editing Dashboards, often you have to modify underlying reports in order to change the visualization or customize the report. With this alpha release, we allow users to directly access the Report Edit Mode from the Dashboard Edit Mode:
Moving Process and Decision Reports across environments
In Optimize 3.3.0 we are introducing the possibility of exporting process, decision and combined reports, as well as dashboard configurations as JSON files in the Optimize user interface. The exported JSON files can be imported into other Optimize environments of the same version and with the same process or decision definitions. This allows users to move created reports or whole dashboards across environments, e.g from a staging environment to production:
Simply export the report from the homepage or collection page:

Afterwards, import the downloaded JSON file into a collection or on the homepage:

The functionality is only available for super users right now. Please find more details in our documentation on how to configure super users.
External Process Events Inspection and Deletion
When using Process Events Monitoring for monitoring End-To-End Processes that include systems not yet orchestrated by the Runtime Engine, you can ingest process events into Optimize.
With this release, we added the possibility of managing ingested events directly in the User Interface of Optimize. You can find the overview table within the Event Based Process main navigation:
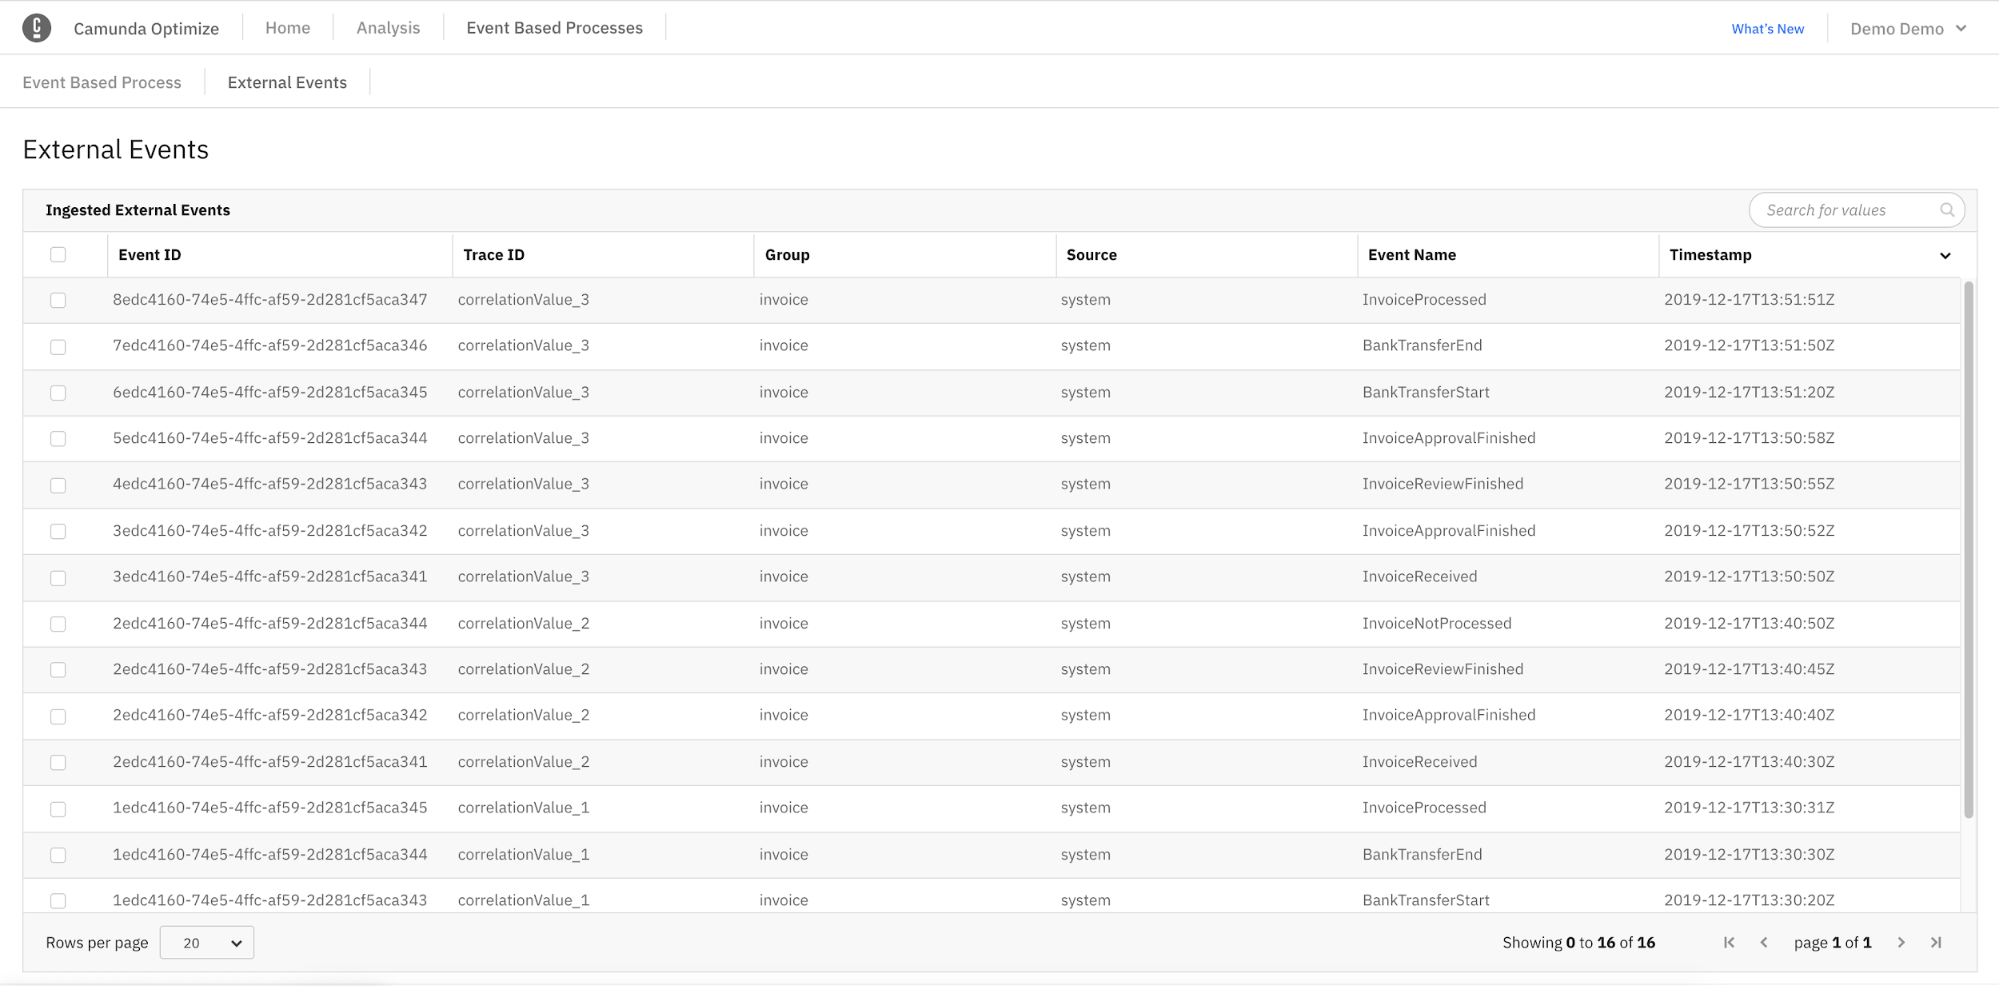
Besides investigating the external events that were ingested via REST API into Optimize, this new screen allows you to delete single or multiple external events at the same time:

This functionality is especially useful when building new connectors or integrating new systems with Optimize.
Improved Updates and Maintenance
Resumable Updates
From Optimize 3.3.0 onwards, updates are resumable. So if the update process got interrupted, either manually or due to an error, you don’t have to restore the Elasticsearch backup and start over, but can simply rerun the update. This will save valuable time when updating Optimize, especially when managing large amounts of data. Please find more details in our documentation.
Updated Support for Elasticsearch
With this release, we are dropping support for Elasticsearch 7.0.x, 7.1.x, and 7.2.x.
While dropping support for these versions, we are adding support for Elasticsearch 7.9.+ as well as 7.10+. The full list of support environments can be found in our documentation.
How to get it
If you want to give Camunda Optimize a try, you can download the release here with your Enterprise customer credentials. Alternatively, sign up for a free 30-day trial version.
If you’re new to Optimize, we recommend that you watch the Getting Started with Optimize in less than 5 Minutes video.
If you want to update to the latest version, check out our update guide in our documentation.
