Camunda Optimize is used successfully by many organizations across the world to visualize end-to-end process automation, supporting continuous process and decision table improvement by providing transparency into automated workflows and decisions.
As Optimize is maturing, new features and a better understanding of user needs required a refinement of the tool’s UI and provided Camunda’s design team with an opportunity to improve the user experience.
Goal of Redesign
Enabling users to quickly get a view on their data and easily gain insights into their processes. Let Optimize do the work, and the data tell the story.
Why the Redesign
Optimize allows users to create a wide range of Reports. However, these were not always intuitive to set up. With more features and functionalities coming in the future, it is imperative to create an easy to use understandable interface.
We needed to find solutions for three main challenges:
Linear configuration
In order to display a visualisation of data, it was necessary to configure a number of required sequential options correctly. For example, in order to display Optimize’s popular heatmap, users had to select the correct configuration from four different drop downs before the visualization would appear. No quick view method was available to allow the user to display the data and then refine configurations as needed.
Hidden controls
The horizontal sidebar left little room for additional configurations, which were then placed behind a hidden visual configuration option menu — making these options difficult to find.
Lack of space
Configuration of the Report occurred in a horizontal panel. Additional configurations further expand the height of this panel. As a result, the visualization display viewport would be encroached upon, limiting the area for chart display.

Goal
So let’s come back to the main goal:
Enabling users to quickly get a view on their data and easily gain insights into their processes. Let Optimize do the work, and the data tell the story.
How can we achieve this? By creating a framework that enables an intuitive user experience. One which supports a quick view on data, findable controls for refinement of the data view and one that is flexible enough to transcend our current functionality to accommodate new features and configurations.
Easy!
How we did it
1. Understanding existing users & our business goals
Through developing a clear view of our own business goals and the needs and pain points of our users, the team was able to create a base of understanding and a clear view on what we want to improve and who for.

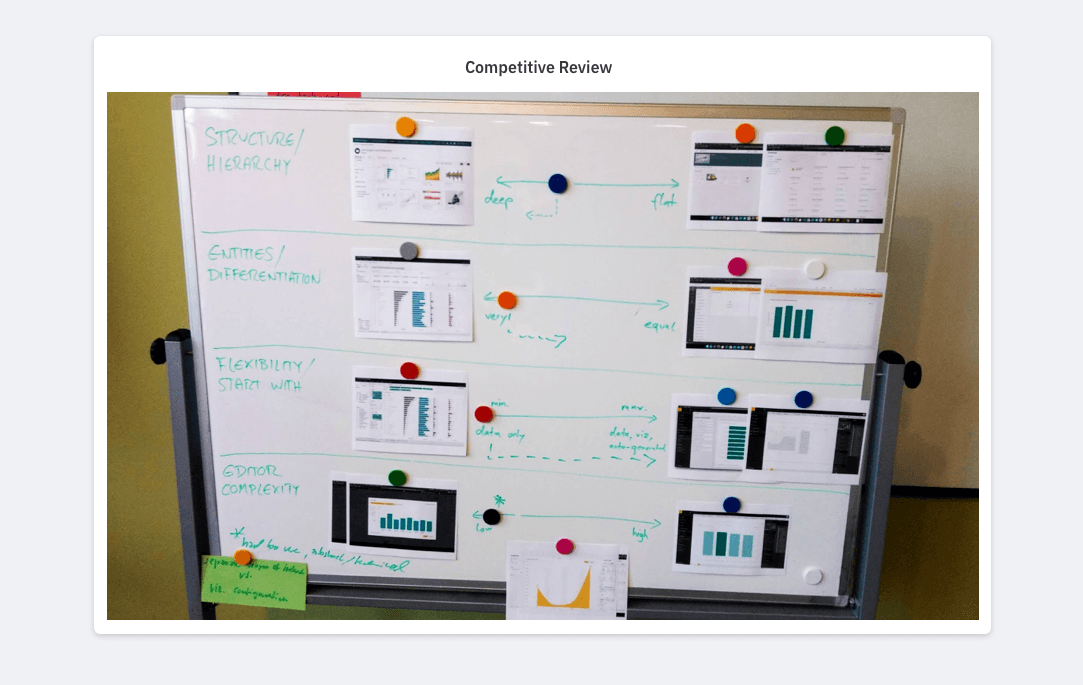
2. Competitive analysis
We undertook a competitive analysis, to understand how other business intelligence tools handle similar challenges and investigate any innovations or missteps that we can learn from.
Based on our research we were able to make decisions on which level of complexity would best serve BPMN functionality, business use cases and our user personas.

3. Ideation – workshops and stakeholders
We undertook a number of workshops where we created concepts without restraint.
The Product management, development and design teams worked together closely. Multi disciplinary team collaboration is key to ensure a range of viewpoints are investigated.

4. Focusing on a final concept
Once we’d opened our minds to other options, we became more aligned with what to build. What resulted was a framework which solved the current issues and took into account future functionalities, within a familiar UI.
After multiple sessions of prototype testing, as well as discussions within and outside of the team, we came up with the new Report builder concept.
The result
In the last months, the development and design teams have worked together to build the aforementioned concepts. We have found solutions to the previously presented problems.

Sidebar Configuration
A scrollable sidebar enables the display of multiple inputs and filter snippets without limiting the visualization viewport. Each section is collapsable to limit visual distraction.
Single click visualisation display
Once the view on the data is selected, the following configuration defaults to a preset, in order to enable a visualisation display in one click. This can then be used to change the visualization type, refine the grouping or add filters. The user is able to see the effect of the configurations directly in their visualization.
Visibility of controls
Easily find configurations to add a distribution to your chosen data display, show both counts and durations simultaneously and set aggregations for integer variables and durations.
Saved Report detail pop-overs
From a saved Report view, it is easy to see the configuration setup, display the process diagram and Raw data for the contained instances, as well as creation details and any applied filters.
Create New via Templates
By adding options to create common use case templates for both single Reports and multiple Reports dashboards, we have even outreached the original goal of allowing creation of Reports in one click. To use, simply select the desired template in the create modal.
View the below videos to see Optimize in action:
Creating a Report
Creating a Report
Setting aggregations
Setting aggregations
…and now we continue
As development progresses, the addition of new features and further experience refinement will continue to improve Optimize as a tool. Thank you for reading.
If you are interested in giving feedback or participating in a user test please leave a comment in the Optimize forum. If you are an existing customer you can also reach out via support.


