
When using tools like incident.io to manage your incidents—not talking about Camunda incidents in your business processes, but incidents that relate to your general system/offering and production system—it is often useful to get an overview of ongoing incidents. Furthermore, it is beneficial to get reports based on certain (custom) filters like affected teams, severity, etc.
Unfortunately, incident.io doesn’t support this type of reporting out-of-the-box. Camunda can help here ????
Today, I want to show you how you can get the necessary statistics from incident.io, extract the necessary results, and post them for example to Slack to create a daily incident statistics update with Camunda.

Get details from incident.io
The incident.io API is rather simple and well-documented. All necessary information can be found in their API docs https://api-docs.incident.io/.
API Key
As a first step, you have to create an API token. Follow this guide to create one.
After you have this make sure to store it somewhere safe.
Incidents API
We want to get the current statistics for the Incidents for that we have to query: https://api.incident.io/v2/incidents.
In our daily update, we are only interested in ongoing incidents for that we need to filter status_category[one_of]=live. Details of this filtering mechanism are also described in their documentation.
It becomes interesting if you want to filter for custom_fields (which you have defined earlier on your own). That can be for example the affected team, or other details you add to your incidents. Be aware that you have to find the corresponding IDs for the custom_field and also the potential options.
To find these you can either query the https://api.incident.io/v2/custom_fields endpoint or run a query against the incidents endpoint, as the response contains all necessary information.
Example
After you find all the necessary filtering (or just if you want to experiment with something) you can use the following script to try your query.
#!/bin/bash
#
# Script to query incident.io API
set -euo pipefail


if [ -z $1 ];
then
  echo "Must provide an api token to query incident.io api"
fi

token=$1

incidents=$(curl --verbose --get https://api.incident.io/v2/incidents \
  -H "Accept: application/json" \
  -H "Authorization: Bearer $token" \
  --data 'custom_field[<CUSTOM_FIELD_ID>][one_of]=<CUSTOM_FIELD_OPTION_ID>&status_category[one_of]=live'
)

# Custom fields need to be addressed with IDs

count=$(echo $incidents | jq '.incidents | length')

echo "$count incidents"
echo $incidents | jq '.incidents[].name'
Example usage
$ ./incidentsStats.sh $token
  % Total    % Received % Xferd  Average Speed   Time    Time     Time  Current
                                 Dload  Upload   Total   Spent    Left  Speed
100  459k    0  459k    0     0  1054k      0 --:--:-- --:--:-- --:--:-- 1055k
10 incidents
"support-123"
"support-2124"
"support-20124"
"123124"
"SUPPORT-1232"
"Some other incident"
"test incident"
"SUPPORT-2012"
"support-2014212"
"SUPPORT-112"
With that script running we have everything ready and can get things automated.
Automating with Camunda
You can either get a trial account here, or host Camunda on your own, for example with the provided Self-managed version.
For simplicity reasons, I will skip the details here, and we expect the usage of the Camunda SaaS offering. Furthermore, will concentrate on the modeling details mostly (using Web-Modeler).
Follow these instructions here if you are unsure how to model your first diagram.
Adding Incident.io API key as Connector secret
When querying the incident.io API we need an API key, as described above. To make this available to our process instances and connectors we have to create a secret in our Camunda cluster.
For more on how to create a secret for your Camunda cluster, take a look at this guide.
In the end, it should be similar to the below:

Query incident statistics via REST Connector

After we have created our Camunda cluster, added our Connector secret, and started modeling we can add a REST Connector. Details about this can be found in the documentation here.
In the properties panel of the REST Connector, we have to specify all important details, similar to what we used in our script above.

One important part we need to add as well is the result expression which would look like this:
{
   incidentIoResponse: response.body
}
This maps the response body to our variable incidentIoResponse. With that, we are already ready to query the details of our incidents. You can either test this by creating a process instance and verifying the results or you just continue with the next step.
Extracting incident details
After we get all the incident details from incident.io we need to extract the important details. We can do this by defining a script task in our process model and implementing it with FEEL expressions.

Depending on what you are interested in you want to extract different details. For all the potential properties of incidents, you can take a look at the incident.io API documentation here.
In our example, we are interested in:
- Incident name
- Incident Severity
- Incident permalink, which points to the incident.io page
- The related Slack details (channel name and ID)
- The incident command (with name and Slack ID)
- Incident count
All of this can be extracted with the following FEEL expression:
{
    incidents:
      for incident in incidentIoResponse.incidents
      return { name: incident.name,
               severity: incident.severity.name,
               permalink: incident.permalink,
               slack_channel_id: incident.slack_channel_id,
               slack_channel_name: incident.slack_channel_name,
               ic_name: incident.incident_role_assignments[item.role.shortform = "commander"].assignee.name[1],
               ic_slack_id: incident.incident_role_assignments[item.role.shortform = "commander"].assignee.slack_user_id[1]
             }
    ,
    incidents_count: count(incidentIoResponse.incidents)
}
With the FEEL for loop, we are iterating over the incidents, and creating for each incident a new context (object).
The FEEL list filter allows us to find the incident commanders and their respective names and Slack IDs.
Sending statistics via Slack Connector

Camunda supports several Connectors out-of-the-box, not only the REST Connector but also a Slack Connector. That Slack Connector we use in our example to send our statistics to a respective channel.
Of course also here we need an API key to access the Slack API, and you can follow this guide to create a Slack OAuth token.
Similar to the REST Connector, we need to add the Slack OAuth Token to our Connector Secrets. Follow this documentation if you need to know how to create/add them to your cluster.

After adding the secret we can start with modeling the Slack Connector.
We have to specify some details, like which channel or user should get the update. Furthermore, we have to specify what the message should look like.

For the Slack message, we can use again a FEEL expression.
":incident-heart: This is your daily incident update :incident-io:\n\n"
+ "We have currently *" +string(incidents_stats.incidents_count) + " ongoing Incidents*\n\n\n"
+
string join(
  for incident in sort(incidents_stats.incidents, function(x,y) x.severity < y.severity)
  return incident.severity + " - <" + incident.permalink + "|" + incident.name + ">" + " IC: <@" + incident.ic_slack_id + ">"
, "\n")
Formatting the Slack message has to follow some guidelines, which we can find in the Slack documentation here.
As the first part of the message, we want to post some header (with some nice Emoji—this of course depends on your Slack workspace whether this is available or not).
As the message field expects a string we have to concatenate everything to one string. We have to iterate over the incidents and join them via the string join function. This function allows us to specify a delimiter, which is in our case a newline.
To sort our incident list by severity we can use the FEEL sort function.
We can now experiment with our model and it should send a message already to a specified channel or DM, when we create a process instance for the definition.
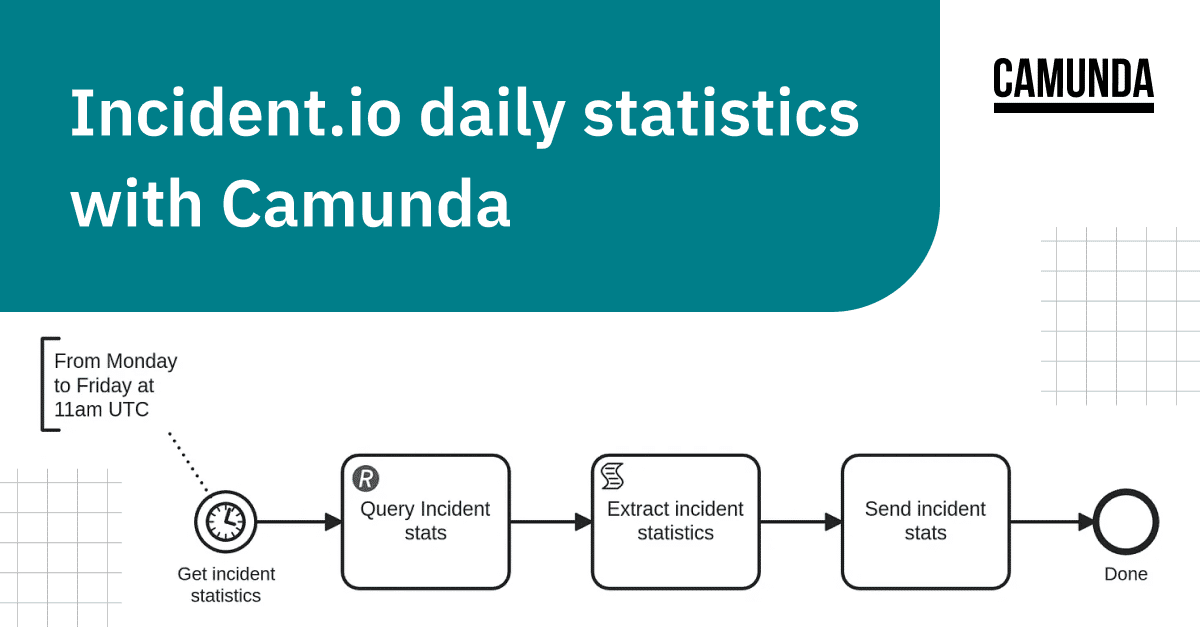
Running it every working day
As the last step, we want to execute/run it every working day at the same time. In our example, we want to do it always before lunch (around 12 o’clock CET). To achieve this we model a timer start event with a cycle expression. Details about this can be found in the documentation here.
The example expression we would use is 0 0 11 * * MON-FRI. We are referring here to 11 as we specify here the time in UTC.
Be aware that tools like crontab-guru don’t parse this expression correctly as they don’t expect the seconds (at the beginning). Here the expression would be 0 11 * * MON-FRI.
Daily incident statistics with Camunda
After modeling all our logic (wiring everything together) we can deploy this to our previously created Camunda cluster, and as soon as the right time is reached we will see a Slack message like this:
As you can see there is not much magic behind it, it is quite “easy” to generate a daily report from an external source, like incident.io.
You don’t need to scrape the statistics manually anymore and put them into a good format to share them with others. We were able to completely automate this.
That is the power of Camunda: “Automate Any Process, Anywhere.”
P.S.: The possibilities for further things are endless, for example, auto-assigning an engineer to an incident, based on current ongoing incidents (related to statistics and load).
P.P.S.: If you like this post please let us know on the forum, where you can leave a comment. I’m open to any other feedback as well.
Editor’s note: This post first appeared on Medium. We have republished it here with slight edits for clarity.


