Camunda Optimize Reports:
Actionable insights to monitor and improve process health
Quickly understand how your business processes are performing
Monitor and improve your process health and performance with data-rich analytics. Camunda Optimize gives you the insights you need to continuously improve your end-to-end business processes. Easily uncover opportunities in your process flows and decision tables with expressive dashboards created using your process data.
Make data-backed improvements to any process
Knowing exactly how your process is performing is crucial for success. Watch the videos below to see how Optimize gives you the insights you need to monitor and optimize process health.

Are we hitting process KPIs across different departments?
Know how well your processes are performing so you can prioritize improvements with data to back it up. Optimize helps you pinpoint opportunities to improve performance by narrowing your view to specific flow nodes or time periods. Additionally, you can specify target values and visualize them in a shareable dashboard that's easy to understand.
How can we improve our decision tables to reduce bottlenecks?
Provide in-depth analysis of the DMN decision tables being called by BPMN processes outside your processes. You can look at the number of evaluations as a single number, grouped by input and output variables or evaluation time. Optimize also allows you to look at the number of matches each rule had, helping you identify which rules are never or most frequently used.
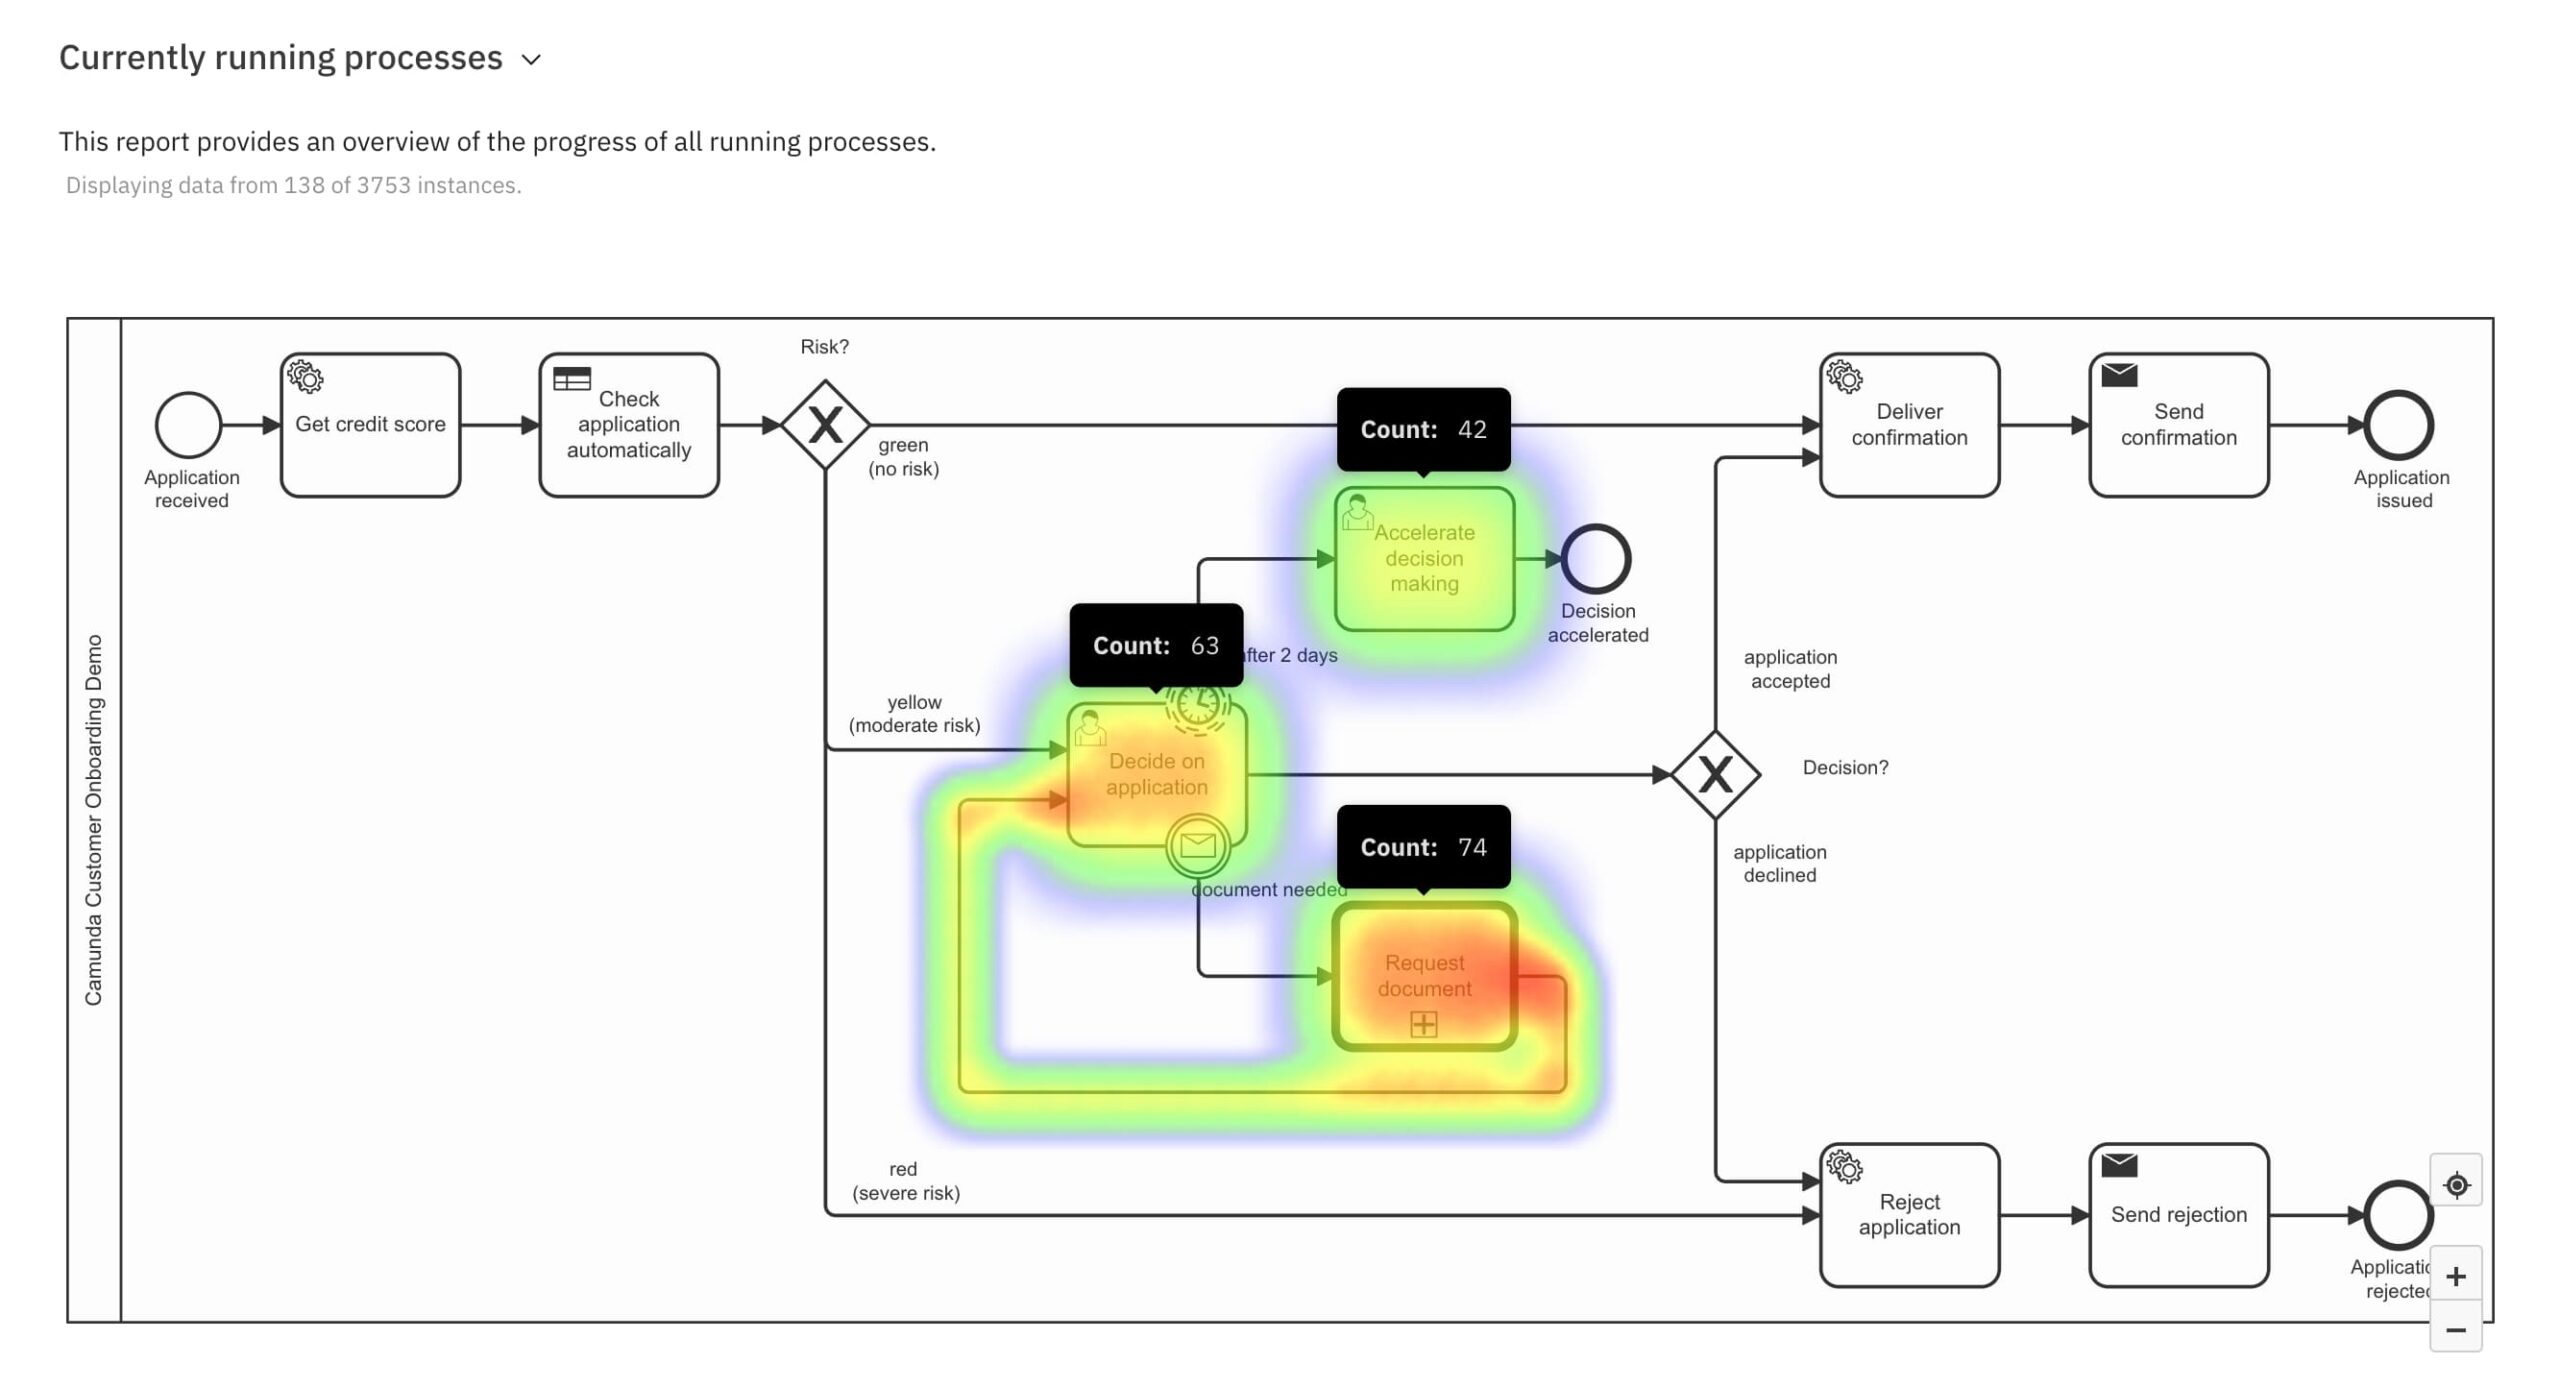
Which steps in the process are executed most frequently?
Uncovering bottlenecks can be challenging with advanced workflows because there are several areas where a slowdown can happen. Optimize can help you find bottlenecks by taking a closer look at the number of flow node executions to show which steps in the process are executed most frequently.
What is the average time a process instance takes to complete?
Process owners need to know workflow durations depending on different process variables. With Optimize, you can group process instance durations by minimum, maximum, median, and average related to specific process variables. Grouping variables lets you uncover which areas impact a process the most so you can take action.
How many process instances have been executed this year, and has this number changed over time?
Every organization has a level of seasonality that can impact process performance. Knowing the variations can help you identify when you'll need to add resources or when you can cut back. Optimize lets you quickly create reports to analyze the number of process instances executed within a specific set of custom parameters. You can create single-number reports or group multiple reports by different characteristics, such as the start date of the process instances.
What's the average length of time for a specific task?
Narrowing your optimization efforts to a single task can help you better pinpoint opportunities for improvement. Optimize allows you to analyze your workflow's minimum, maximum, median, and average task duration on any flow node to highlight bottlenecks.
How much time did the longest step in a process take?
Sometimes you want to focus your optimization efforts on a specific step in a long-running, complex process. Beyond analyzing minimum, maximum, median, and average durations for end-to-end processes, you can select a portion of a process to better understand its performance and start to develop ways to improve it.
Is our team carrying out the process quickly enough, or do they need more time?
You need analytics to better understand how a process is performing and to make changes so your team can better manage the workload. Optimize allows you to define target values for frequency reports and specify target values for flow node durations when using the BPMN heatmap visualization. Heatmaps change colors to highlight where processes are taking too long so you can see where to focus your optimization efforts.
What is the average time spent on User Tasks?
Inspect User Task durations in greater detail. You can look into Idle, Work, and Total durations of User Tasks to find opportunities to speed up the process. With the help of a Combined Report, the numbers can even be compared in bar and line charts.
Are there any User Tasks that take longer than usual?
Identifying specific tasks that take significantly longer than expected helps you better prioritize actions you can take to improve a process. Optimize also helps you conduct root-cause analysis by automatically showing significant variable combinations within these instances. This data helps you understand why specific tasks took so long to complete.
