With camunda 7.4, we released the new Camunda DMN engine. Some people asked how fast the DMN engine is. So I created a benchmark measuring the number of decision tables the DMN engine can evaluate per second. Below you’ll see that I can push the performance to > 200.000 evaluated decisions / second on my notebook, using a single thread!
Description of the Benchmark
The benchmark measures executed decision tables / second.
The Decision Tables Used
Different decision tables are used. This allows us to get insights on how
- the total number of rules,
- the number of matching rules,
- the number of inputs
influence performance.
All decision tables pass the input values from a double variable. The variable is compared with a double value that controls the number of matching rules. The output value is a string.

Benchmark Infrastructure
I did the benchmarks on my local machine:
- Intel Core i7 (4 Cores, 2.69 Ghz)
- 8GB Main Memory
- SSD Hard Disk,
- Windows 10
All Tests use a single thread.
For the tests using history and repository, I used a local MySQL database.
Note that we are not interested in absolute numbers anyway, as that depends on a huge amount of factors (e.g., processing power, main memory, network, database, decision table, expression language, etc.). You can easily run the benchmarks on your own infrastructure and with your own decision tables. See the GitHub repositories for details:
The Results
Let’s just switch on all the Lights
First, I’ll present the results of using the DMN Engine with all features switched on: history and repository.
To do that, I first deploy a decision table to the Process Engine’s Repository and then use the DecisionService to evaluate the decisions.
This is the equivalent of using the decision engine from a BPMN Business Rules task using history level FULL.

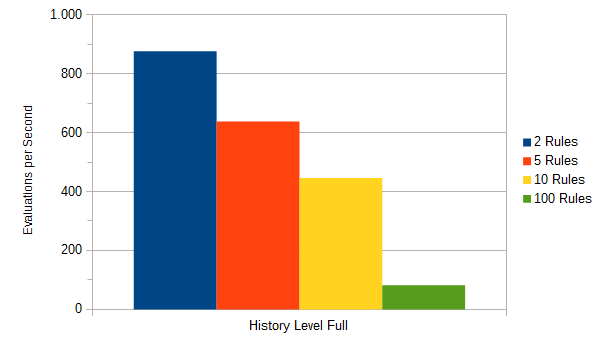
As you can see in the chart above, at history Level full, the decision engine can evaluate around 876 evaluations/second with two rules, a little over 600 evaluations/second with 5 rules and over 400 evaluations/second with 10 rules. This is a decent result!
At 100 matched rules (i.e., all rules match) the throughput is 81 decisions/second. This is not bad if we consider that that we use a single thread (using more threads would increase the performance) and also considering that this means that 100 rules match. I repeat that: it does not mean that there are 100 rules, it means that 100 rules match or in other words: 100 rules are true. In reality this will most likely not happen: what is the point of evaluating a decision table with 100 rules, if all of these are true? However, in this benchmark we want to push things to the max.
Turn off History
Let’s now switch off history to see how much faster this thing can run without the bookkeeping:

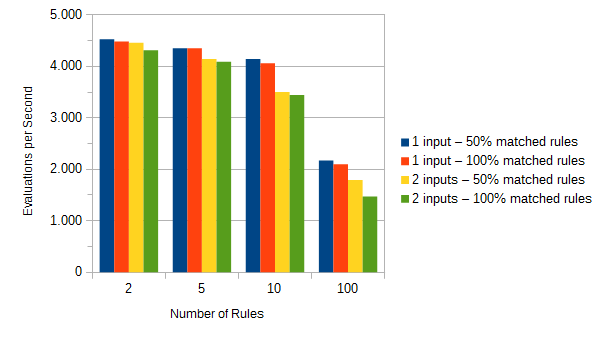
Wow, that is quite a significant improvement. With history, the engine evaluates up to 876 decision tables per second. Without it is around 4.500 which is around five times better than without history.
Where does this performance gain come from?
A brief look into the SQL Statement Log shows that at history level FULL the engine performs 4 INSERT and one SELECT statement:

The number of inserts increases depending on the number of rules. The detail view shows why.
{
  "statementType" : "SELECT_MAP",
  "statement" : "selectLatestDecisionDefinitionByKey",
  "durationMs" : 3
}, {
  "statementType" : "INSERT",
  "statement" : "insertHistoricDecisionOutputInstance",
  "durationMs" : 1
}, {
  "statementType" : "INSERT",
  "statement" : "insertHistoricDecisionOutputInstance",
  "durationMs" : 0
}, {
  "statementType" : "INSERT",
  "statement" : "insertHistoricDecisionOutputInstance",
  "durationMs" : 1
}, {
  "statementType" : "INSERT",
  "statement" : "insertHistoricDecisionOutputInstance",
  "durationMs" : 0
}, {
  "statementType" : "INSERT",
  "statement" : "insertHistoricDecisionOutputInstance",
  "durationMs" : 1
}, {
  "statementType" : "INSERT",
  "statement" : "insertHistoricDecisionInstance",
  "durationMs" : 0
}, {
  "statementType" : "INSERT",
  "statement" : "insertHistoricDecisionInputInstance",
  "durationMs" : 1
}
The engine performs one insert for each output value. So the number of matching rules and the number of outputs have an influence of the performance when the history is on.
Turn off the Repository
What about the SELECT statement we saw in the SQL statement log? This statement does not “go away” when we run the test at history level None:
[{
  "statementType" : "SELECT_MAP",
  "statement" : "selectLatestDecisionDefinitionByKey",
  "durationMs" : 3
}]
This makes sense since the history is insert-only. In fact, the SELECT statement is not related to the history feature but related to the repository. The statement is named selectLatestDecisionDefinitionByKey and this is exactly what it does. When executing a decision deployed to the repository by calling evaluateDecisionByKey(...) the repository fetches the latest version of that decision from the database. (Actually the parsed decision model is kept in cache but the engine needs to make sure the cached version is still the latest version).
Now, let’s switch that off as well:


Baam!
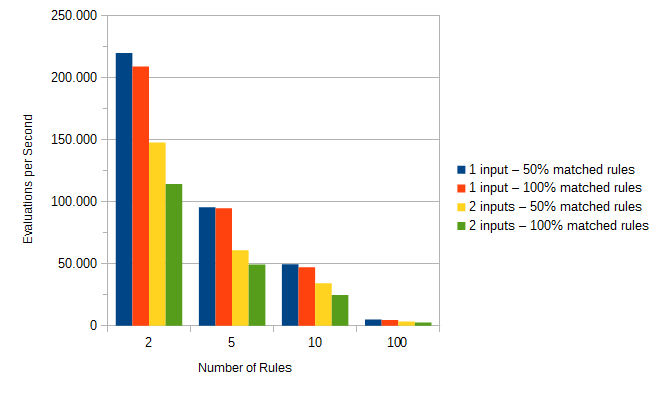
The DMN engine can now evaluate up to 220.021 decisions/second with a single thread! I repeat: with a single thread! This means that evaluating a single decision table takes 0,0045 milliseconds.
Looking a little closer into the results, we see that the number of the evaluated input entries is the major performance factor. The output entries have less impact which is not surprising since the expression is simpler. The more rules or input entries a decision table has, the more time is needed for evaluation.
The results also show that the performance can be influenced when the decision table has more than one input. During the evaluation of a rule, the input entries are evaluated to check if the rule is matched. If the check of an input entry returns false then the other input entries are not evaluated since the rule can not be matched anymore.
This concludes my little excursion into the world of DMN benchmarking. Make sure to leave comments below the post in case you have any questions on this.
