Zeebe is the distributed and fault-tolerant process engine behind Camunda 8 and has been engineered for over five years by a dedicated team at Camunda. At the beginning of 2023, the Zeebe team was split into two separate teams to focus on different aspects of the system. One team concentrates on the distributed system and overall performance (Zeebe Distribution Platform Team, ZDP), and the other fully focuses on all process automation details across BPMN and DMN (Zeebe Process Automation Team, ZPA).
Of course, features like supporting new BPMN elements or having DMN support are more visible than features like improved throughput with large state, etc. This is why we want to spend some time here to recap what happened in 2023 from the perspective of the ZDP team regarding performance and improving the distributed system.
In this blog post, you will find several details about features we have implemented over the year on a high level. Most of the time, we will link to related GitHub issues, so you can dive deeper if you want. Most of these features have been benchmarked with our benchmarking setup. I want to shortly go into the details so we can clarify this upfront.
Benchmarking
We set up performance and load tests for new features or bug fixes where we think it makes sense to see how the change affects the cluster performance. Furthermore, we have weekly benchmarks which are set up automatically to detect regressions.
The basis for our benchmarks is our Camunda Platform Helm chart, where we added some testing applications on top. One of these applications is in charge of creating new instances at a specific rate, called the “Starter.” In all our benchmarks (if not otherwise specified) we will run with the same load of 150 process instances per second (PI/s). The second application is the “Worker” which makes sure that Jobs are activated and completed (after a configurable delay). By default, the completion delay is 50ms. That means at minimum a process instance takes at least 50ms.
We always use the same process model (if not otherwise specified), which consists of one service task, and a big payload.

In all our benchmarks the Zeebe clusters are configured the same, and only the Docker image changes. We run with three brokers, two standalone gateways, three partitions (replication factor three), three workers, and one starter.
For more details, you can check the readme in our Benchmark Helm chart repo.
After that short excursion, let’s jump into the features we have implemented.
Batch processing
The year started with an interesting topic: how can we improve the process instance execution latency in an environment where the network latency is high? The answer? Batch processing.
I already wrote a full article about this here, where you can find more in-depth details.
Summary
Since Zeebe uses Raft and wants to provide strong consistency, Zeebe needs to make sure that user commands (which are driving the execution of a process instance) are committed before being processed.
A command is committed when it is replicated to and acknowledged by a quorum of nodes. This can result in high commit latency if the network is slow. Zeebe splits the processing into user commands and internal commands. Previously, each of them was committed and processed individually. It has shown, based on our investigation and benchmarks, that it is worth batching internal commands together. This is quite similar to what is done in Camunda 7 where we process the process instances until a wait state.
Result
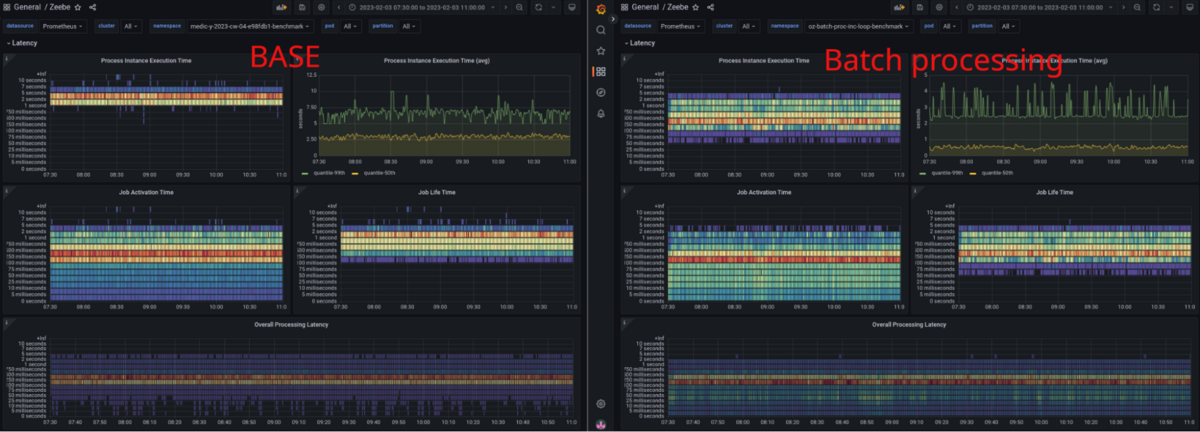
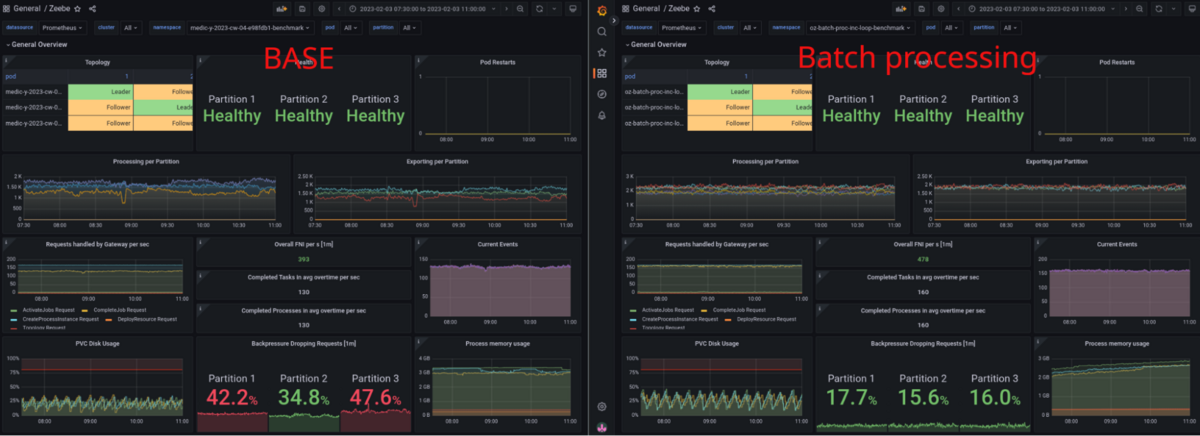
With this change, as you can see below, we were able to reduce the process instance execution latency by half and increase the maximum throughput by 20% in our benchmarks. For more details, see this issue.
Improving the performance of hot data with large state
Due to certain investigations, benchmarking, testing, etc., we observed that our system runs into performance issues when working with a larger state. Particularly, when we hit a certain limit of state in RocksDB (used in Zeebe) the performance unexpectedly drops. We documented this in a Chaos day as well.
We worked on some initiatives to resolve this situation following a few customer requests. For example, the idea that hot data should always be executed fast/performant, and cold data or big state shouldn’t have an impact on new data and their performance.
Summary
After evaluating several approaches on how to improve our performance with accessing RocksDB, we found quite an interesting configuration in RocksDB that changes how we write our data. It separates key-value pairs, based on a prefix into their own SST files.
It is worth mentioning here that Zeebe uses only one real column family in RocksDB (to minimize disk space and memory usage) and uses key prefixes to produce an artificial data separation (also called virtual column families). This works since keys are sorted in RocksDB. This allows one to seek to a certain prefix, iterate with the given prefix to find all related data, and stop when a different prefix has been encountered.
We have observed that having this setup and a lot of data, read access and especially iteration becomes slower as soon we hit a certain size limit. By partitioning data into their own SST files, grouped by prefixes, we were able to restore performance. The performance was similar to what we would get by separating data into real column families but with much less overhead.
We documented several benchmark results here.
Result
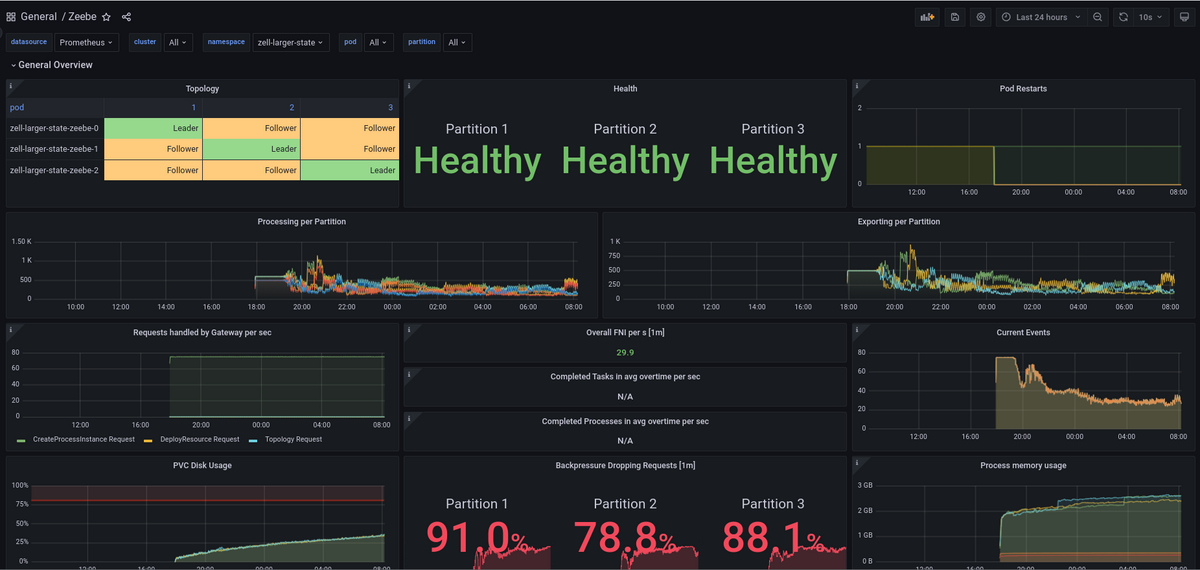
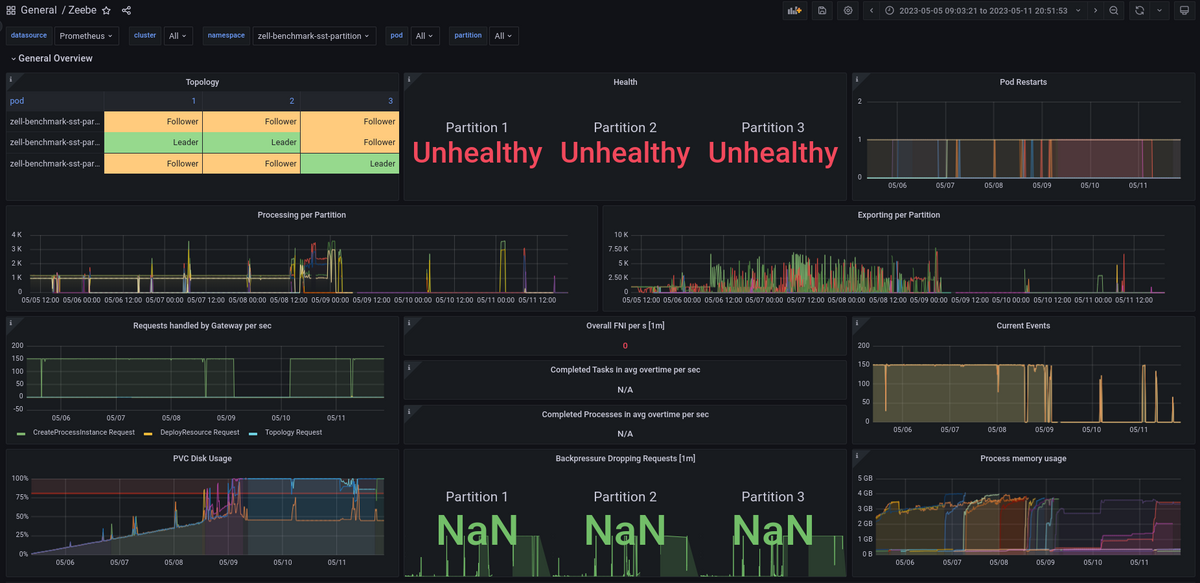
Before our change, our benchmark ran stable until ~1 gig of state had been reached, which caused it to drop in accepting and processing more instances. In this scenario, we were blindly creating instances without completing them.
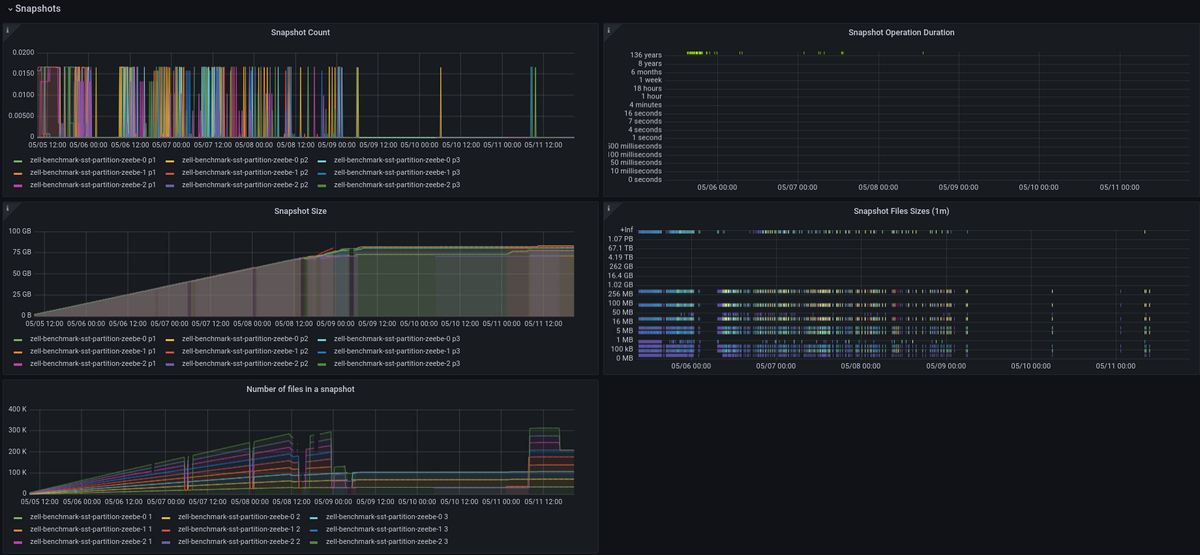
After using the SST partitioning feature from RocksDB, we were able to continuously accept and process new instances until we reached our disk limit:
We did some chaos days (1, 2) to validate and verify the behavior of this feature, especially how it behaves when enabling existing data or disabling it again without breaking running installations.
Cluster availability should not be impacted by runtime state
Similar to the previous topic was cluster availability impacted by a large state in Zeebe. We experienced degradation of availability (and especially recovery) when the state was large.
For example, we had an incident where a large state of data caused Zeebe to no longer recover since our defined liveness probe (with a 45s timeout) caused it to restart the pod every time. This prevented Zeebe from recovering at all.
Summary
We investigated various options to improve the situation and more quickly recover a broker, which includes copying an existing snapshot, opening the database, etc.
Previously when a node bootstrapped, we copied an existing snapshot into the runtime folder, such that we could open and work on the database (RocksDB). This can be quite time-consuming and IO inefficient, depending on the filesystem and size of the state.
RocksDB offers a checkpoint of an open database, which essentially creates hard links to existing SST files; this works great when snapshots and runtime are on the same file system. We use this already for normal snapshots.
One improvement we made was using the same mechanics on recovery. We open the snapshot as a read-only database and create a checkpoint to make the database available as runtime. It turned out to be much faster than copying all the content, especially with larger states. Depending on whether both source and target are different file systems, it might mean that we still copy files, but then we have similar behavior as before.
We previously replicated snapshots into a pending snapshot directory. If the replication was successful, we copied the complete snapshot into the correct snapshot directory; this was to make sure that we only have valid and committed snapshots as part of our snapshot directory. We improved this mechanism in a way that we no longer need to copy the snapshot. We will directly write into the correct folder, and mark the snapshot via a checksum file as complete/valid. This helped to reduce the time spent during snapshot replications. Additionally, we found a way to reuse previously calculated checksums, which gave us a great boost in performance on persisting larger snapshots.
Result
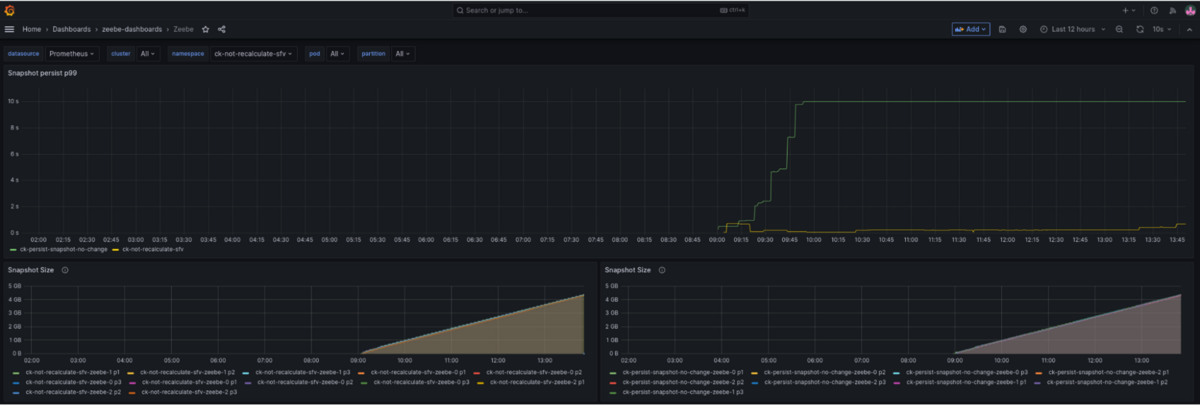
Snapshot persistence has been improved significantly by not calculating checksums multiple times:
We can see that as soon as we reach around one gigabyte, we already have around 10 seconds of snapshot persistence duration (which is the maximum to record, so might be even higher). With our change, we stay under one-half of a second.
Concurrent tasks
Aside from normal stream processing, Zeebe also has to run other tasks. For example, trigger timers or cleaning up buffered messages after they expire.
Previously, these tasks interrupted regular stream processing. This was a problem when these tasks took a long time to process, for example when many timers expired at once. For users with strong latency requirements, this is unacceptable and we needed to find a solution where these tasks don’t interfere with regular processing.
Summary
To not have tasks interfere with regular processing, we decided that they should run on a different thread and concurrently with regular processing. This was complicated by two factors that we needed to address first. First, we needed to ensure that processing and tasks use different transaction contexts. This is important because tasks should not be able to read uncommitted processing results. For example, when we process a new process instance and create timers for it, the processing might fail and the transaction where we create a timer is rolled back.
To fix this, we now create a new transaction for every task execution. This ensures that tasks and processing are isolated from each other and can only read committed results. To improve the safety further, we decided that tasks are not allowed to write to the state directly. For example, the job timeout checker task was no longer allowed to update the job state directly. Instead, all tasks have to follow the usual stream processing rules and can only produce new commands that will be processed eventually.
The second issue was that tasks and processing shared mutable state. This worked fine while both were running on the same thread, but as soon as we ran them on two different threads, access to that data needed to be synchronized. We solved this by making use of normal concurrent data structures such as ConcurrentHashMap.
After addressing both issues, the actual change to run tasks on a new thread and concurrently to processing was trivial.
Result
As a result, processing in Zeebe 8.3 and newer is not interrupted by other tasks. Even if many timers or buffered messages expire at once, normal processing can continue.
This reduces latency spikes and makes processing performance more predictable. While it’s possible to revert to the previous behavior, we collected enough experience with this change to see this as a pure performance and latency improvement that everyone benefits from.
Job push
The following is a summarized version of this blog post, which contains more tests and details. There, we test various workloads as well as resilience use cases.
Before this change, the only way to activate jobs in Zeebe was to poll for them, meaning:
- The client sends an
ActivateJobsrequest to the gateway - The gateway, in turn, sends one request to each partition, polling for jobs, until either it activates enough jobs, or exhausts all partitions.
- If long polling is enabled and all partitions are exhausted, then the request is parked until new jobs are available. At this point, the gateway starts a new partition polling cycle as described above.
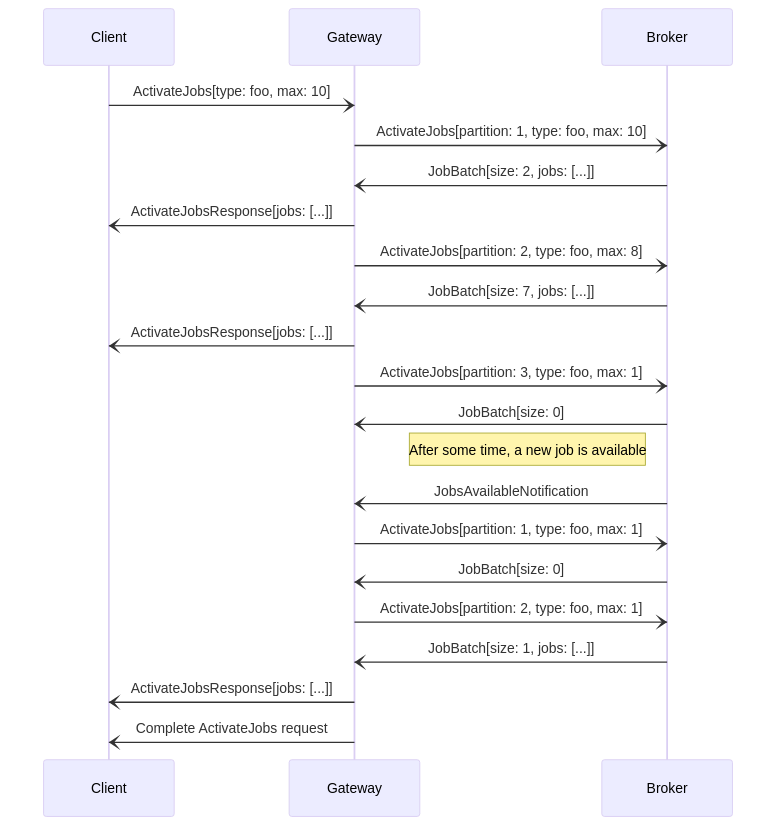
This has several impacts on latency:
- Every request—whether client to gateway, or gateway to broker—adds a delay to the activation latency.
- If you have a lot of jobs, you can run into major performance issues when accessing the set of available jobs.
- The gateway does not know in advance which partitions have jobs available.
- Scaling out your clients may have adverse effects by sending out too many requests which all have to be processed independently. Even with long polling, this is only mitigated.
- In the worst-case scenario, we have to poll every partition; even with long polling, when receiving a notification, we may still have to poll all partitions.
- With long polling, if you have multiple gateways, all gateways will start polling if they have parked requests. Some of them may not get any jobs, but they will still have sent requests to brokers which still all have to be processed. A similar issue exists when many jobs are waiting.
To solve these issues, the team decided to implement a push-based approach to job activation.
Summary
Essentially, we added a new StreamActivatedJobs RPC to our gRPC protocol, a so-called server streaming RPC. In our case, this is meant to be a long-lived stream, such that the call is completed only if the client terminates it, or if the server is shutting down.
The stream itself has the following lifecycle:
- The client initiates the stream by sending a job activation request much like with the
ActivateJobsRPC.- Since the stream is meant to be long-lived, however, there is no upper bound on the number of jobs to activate.
- The gateway registers the new stream with all brokers in the cluster.
- Note that there is no direct connection between brokers and clients; the gateway acts as a proxy for the client.
- When jobs are available for activation (e.g. on creation, on timeout, on backoff, etc.), the broker activates the job and pushes it to the gateway.
- The gateway forwards the job to the client.
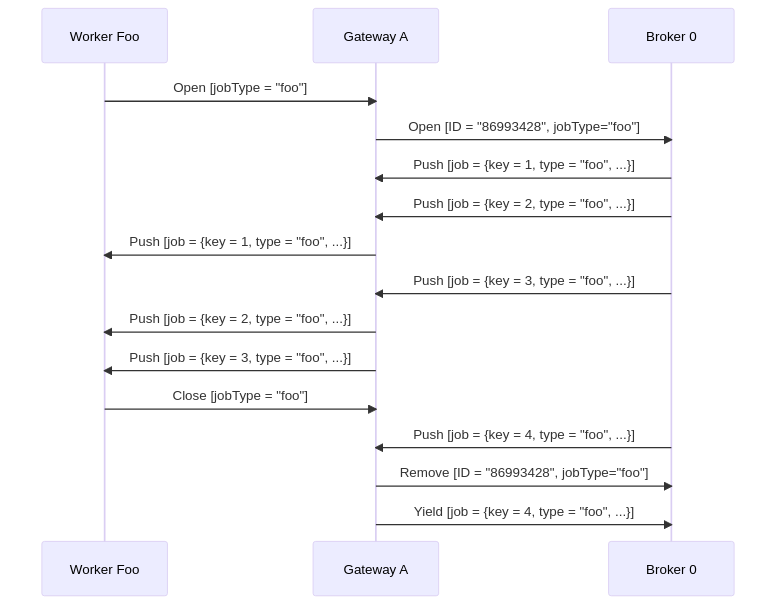
Experienced readers will immediately notice the risk of overloading clients if the brokers/gateways are pushing too many jobs downstream. To avoid this, we also had to implement a form of client-controlled back pressure. Thankfully, we could reuse the built-in flow control mechanisms from gRPC and HTTP/2.
Result
To compare the advantages of pushing to polling, we ran four different experiments. Note that, unless otherwise specified, we always run a constant throughput of 150 PI/s, and our workers simulate work by waiting 50ms before completing a job.
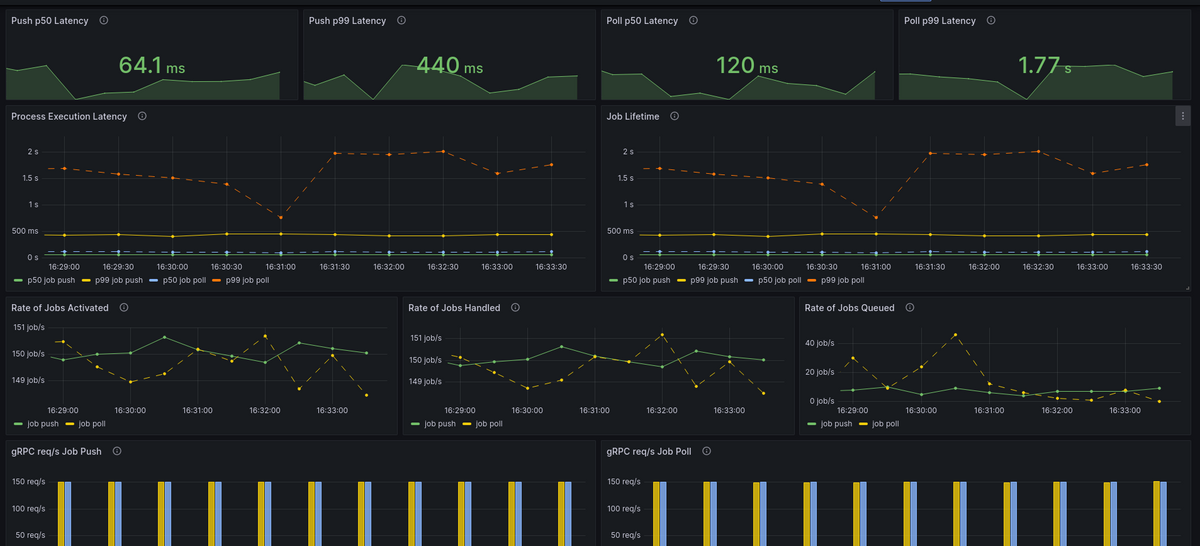
As our baseline test, we ran a constant throughput of 150 PI/s of a process consisting of a single task:
The results show a sharp decrease in both the p50 and p99 of the job lifetime (i.e. the time between creation and completion). Since this workload only consists of a single task, this is mirrored in the overall process execution latency. Overall, we see that switching to a push approach yields a p50 latency improvement of 50%, and a p99 improvement of 75%!
Broker Scaling
While Zeebe’s design enables horizontal scalability through partitioning, it lacked dynamic scaling capabilities until now. This much-anticipated feature has finally been implemented. As a stepping stone towards infinite scaling, Zeebe can now dynamically add or remove brokers to an existing cluster. While you cannot yet change the number of partitions, this capability proves particularly valuable when clusters are configured with many partitions and vertical scaling is not feasible.
Summary
The main blocker to dynamic scaling was that most Zeebe components relied solely on the static configuration provided at startup. To address this, we introduced a new topology management mechanism over gossip that embeds cluster configuration within the Zeebe cluster itself. This topology maintains up-to-date information about the brokers forming the cluster and the partition distribution. When new brokers are added, the topology is updated accordingly, ensuring that upon restart, brokers utilize the current topology rather than the outdated static one.
When a cluster has to be scaled up, the existing partitions have to be re-distributed. To minimize disruptions to ongoing processing, this migration process is carried out in a step-by-step manner. For each partition to be moved from one broker to another, the partition is first added to the new broker and then removed from the old one. This transition is executed by Raft (the replication protocol employed for replicating partitions) and coordinated by the new topology management mechanism. To support this, we implemented a joint-consensus mechanism in Raft to allow changing the configuration of a Raft replication group safely and correctly.
Scaling is orchestrated by a Rest API exposed in Zeebe Gateway. You can read more about it in Camunda documentation.
Result
To demonstrate the scaling, we did a small experiment to scale a cluster with three brokers and six partitions. The following image shows how throughput can be scaled when the cluster is scaled to six brokers.
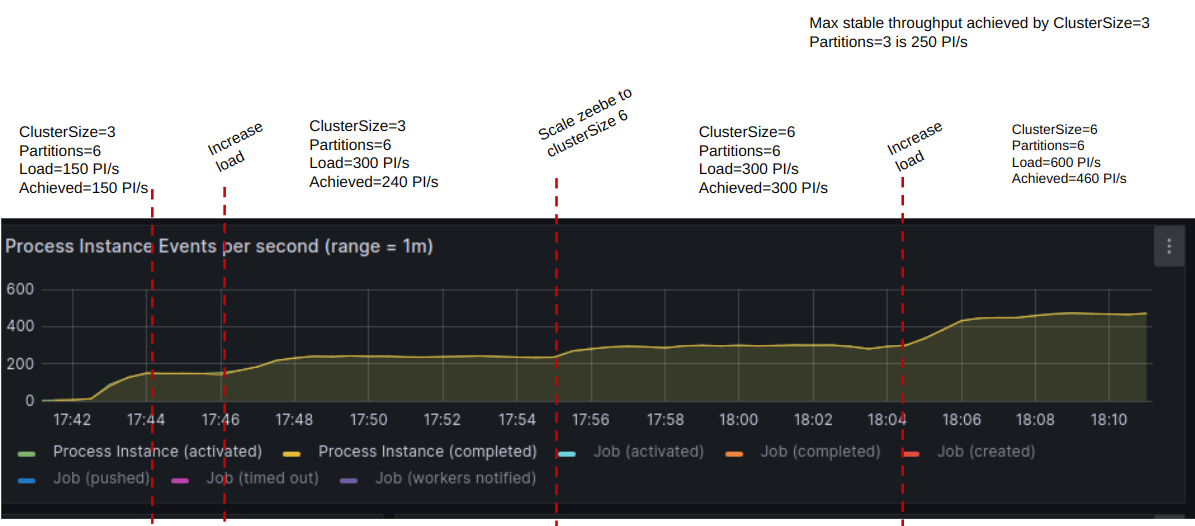
We also held several Chaos days to test this feature and build up confidence. You can read more about it in the following blogs:
- Pt. one: Dynamically-scaling-brokers
- Pt. two: Dynamic-Scaling-with-Dataloss
- Pt. three: Broker-scaling-performance
Conclusion
As you have seen from the above, it was a great year from the Zeebe performance and distributed systems perspective. We were able to ship several new features and improvements to improve our user’s lives.
To better understand the impact of all these improvements, we have run some more benchmarks comparing different released versions. All the benchmarks have used the same process models (single task) and the same load of 150 PI/s.
In the following screenshot, we are showing how the process instance execution time (latency) has been improved. We use here the term p99, which indicates that 99% of requests are completed within the recorded latency, and p50, which indicates that 50% of requests are completed within the recorded latency.
Release 8.1 (Oct, 2022)
We can see that in the 8.1 release, we were in our p99 around four to five seconds of completing a process instance, with one single task. The p50 was around one to two seconds.
Release 8.2 (April, 2023)
In release 8.2, we already reduced the latency by half (mostly due to batch processing). Now having p99 around 2.5 seconds and p50 at around 0.500 seconds.
Release 8.3 (Oct, 2023)
In release 8.3 we were able to further reduce the latency with job push to p99 0.750 and p50 ~0.200 seconds, which is another reduction in latency by a factor of two to three.
This doesn’t take into account changes we made related to big state support, concurrent tasks, or even broker scaling, which would allow us to improve the performance even more.
All in all, year 2023 was filled with great achievements by the Zeebe Team, and we are looking for more things to come in 2024.
Thanks to all who contributed and reviewed this blog post. Namely: Christina Ausley, Deepthi Akkoorath, Ole Schoenburg and Nicolas Pepin-Perreault
