Hi, I’m Chris, Senior Software Engineer at Camunda. I have worked now for around seven years at Camunda and on the Zeebe project for almost six years, and was recently part of a hackday effort to improve Zeebe’s process execution latency.
In the past, we have heard several reports from users where they have described that the process execution latency of Zeebe, our cloud-native workflow decision engine for Camunda Platform 8, is sometimes sub-optimal. Some of the reports raised that the latency between certain tasks in a process model is too high, others that the general process instance execution latency is too high. This of course can also be highly affected by the used hardware and wrong configurations for certain use cases, but we also know we have something to improve.
At the beginning of this year and after almost three years of COVID-19, we finally sat together in a meeting room with whiteboards to improve the situation for our users. We called that performance hackdays. It was a nice, interesting, and fruitful experience.
Basics
To dive deeper into what we tried and why, we first need to elaborate on what process instance execution latency means, and what influences it.

The image above is a process model, from which we can create an instance. The execution of such an instance will go from the start to the end event; this is the process execution latency.
Since Zeebe is a complex distributed system, where the process engine is based on a distributed streaming platform, there are several influencing factors for the process execution latency. During our performance hackdays, we tried to sum up all potential factors and find several bottlenecks which we can improve. In the following post, I will try to summarize this on a high level and mention them shortly.
Stream processing
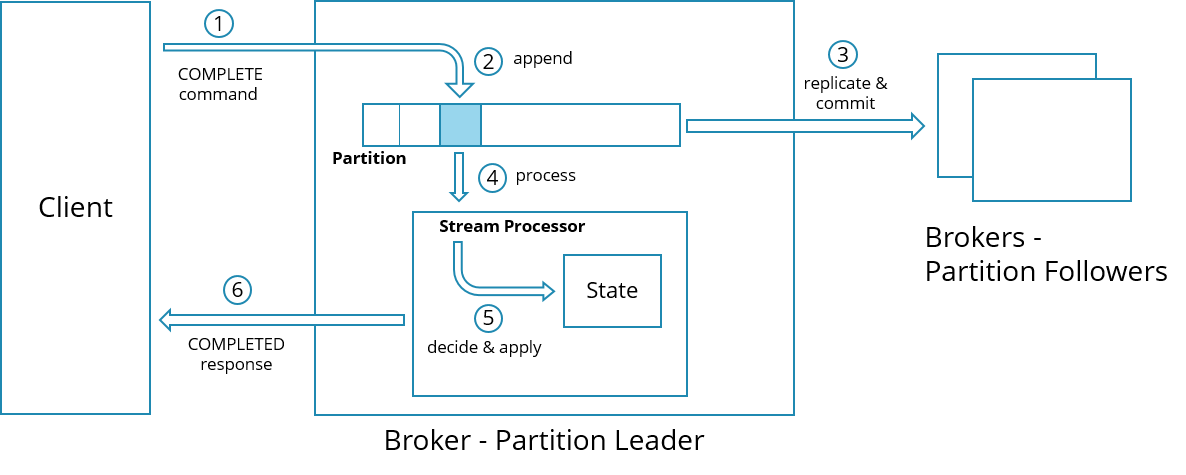
To execute such a process model, as we have seen above, Zeebe uses a concept called stream processing.
Each element in the process has a specific lifecycle, which is divided into the following:
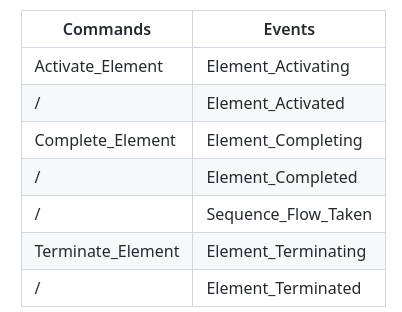
One command asks to change the state of a certain element and an event that confirms the state change. Termination can happen when elements are canceled either internally by events or outside by users.
Commands drive the execution of a process instance. When Zeebe’s stream processor processes a command, state changes are applied (e.g. process instances are modified). Such modifications are confirmed via follow-up events. To split the execution into smaller pieces, not only are follow-up events produced, but also follow-up commands. All of these follow-up records are persisted. Later, the follow-up commands are further processed by the stream processor to continue the instance execution. The idea behind that is that these small chunks of processing should help to achieve high concurrency by alternating execution of different instances on the same partition.
Persistence
Before a new command on a partition can be processed, it must be replicated to a quorum (typically majority) of nodes. This procedure is called commit. Committing ensures a record is durable, even in case of complete data loss on an individual broker. The exact semantics of committing are defined by the raft protocol.
Committing of such records can be affected by network latency, for sending the records over the wire. But also by disk latency since we need to persist the records on disk on a quorum of nodes before we can mark the records as committed.
State
Zeebe’s state is stored in RocksDB, which is a key-value store. RocksDB persists data on disk with a log-structured merge tree (LSM Tree) and is made for fast storage environments.
The state contains information about deployed process models and current process instance executions. It is separated per partition, which means a RocksDB instance exists per partition.
Performance hackdays
When we started with the performance hackdays, we already had necessary infrastructure to run benchmarks for our improvements. We made heavy use of the Camunda Platform 8 benchmark toolkit maintained by Falko Menge.
Furthermore, we run weekly benchmarks (the so-called medic benchmark) where we test for throughput, latency, and general stability. Benchmarks are run for four weeks to detect potential bugs, regressions, memory leaks, performance regressions, and more as early as possible. This, all the infrastructure around it (like Grafana dashboards,) and knowledge about how our system performs were invaluable to make such great progress during our hackdays.
Measurement
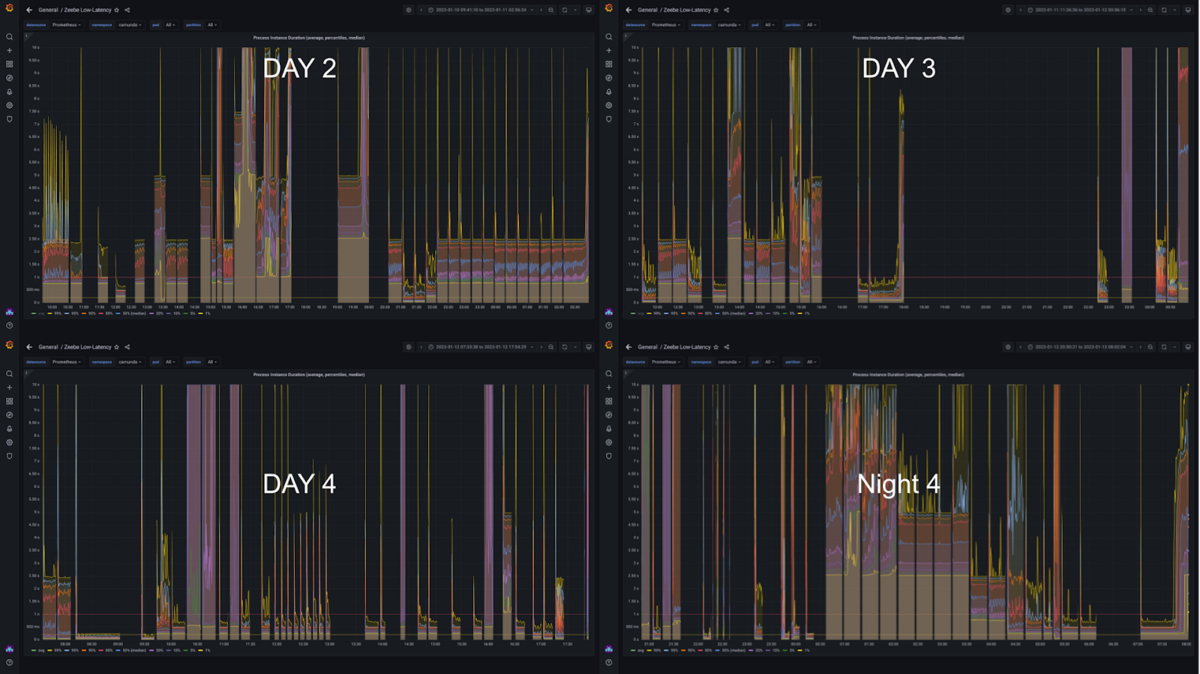
We measured our results continuously, and this is necessary to see if you are on the right track. For every small proof of concept (POC), we ran a new benchmark:
In our benchmark, we used a process based on some user requirements:

Our target was a throughput of around 500 process instances per second (PI/s) with a process execution latency goal for one process instance under one second for the 99th percentile (p99). P99, meaning 99% of all process instance executions should be executed in under one second.
The benchmarks have been executed in the Google Kubernetes Engine. For each broker node, we assigned one n2-standard-8 node to reduce the influence of other pods running on the same node.
Each broker pod had the following configuration:
| CPU | 8 |
| RAM | 16 gig |
| Disk | ssd-xfs |
| Disk size | 100 gig |
| CPU Threads | 5 |
| IO Threads | 2 |
| Partitions | 24 |
| Replication factor | 4 |
| Log segment size | 16 |
There were also some other configurations we played around with during our different experiments, but the above were the general ones. We had eight brokers running, which gives us the following partition distribution:
$ ./partitionDistribution.sh 8 24 4
Distribution:
P\N|	N 0|	N 1|	N 2|	N 3|	N 4|	N 5|	N 6|	N 7
P 0|	L  |	F  |	F  |	F  |	-  |	-  |	-  |	-
P 1|	-  |	L  |	F  |	F  |	F  |	-  |	-  |	-
P 2|	-  |	-  |	L  |	F  |	F  |	F  |	-  |	-
P 3|	-  |	-  |	-  |	L  |	F  |	F  |	F  |	-
P 4|	-  |	-  |	-  |	-  |	L  |	F  |	F  |	F
P 5|	F  |	-  |	-  |	-  |	-  |	L  |	F  |	F
P 6|	F  |	F  |	-  |	-  |	-  |	-  |	L  |	F
P 7|	F  |	F  |	F  |	-  |	-  |	-  |	-  |	L
P 8|	L  |	F  |	F  |	F  |	-  |	-  |	-  |	-
P 9|	-  |	L  |	F  |	F  |	F  |	-  |	-  |	-
P 10|	-  |	-  |	L  |	F  |	F  |	F  |	-  |	-
P 11|	-  |	-  |	-  |	L  |	F  |	F  |	F  |	-
P 12|	-  |	-  |	-  |	-  |	L  |	F  |	F  |	F
P 13|	F  |	-  |	-  |	-  |	-  |	L  |	F  |	F
P 14|	F  |	F  |	-  |	-  |	-  |	-  |	L  |	F
P 15|	F  |	F  |	F  |	-  |	-  |	-  |	-  |	L
P 16|	L  |	F  |	F  |	F  |	-  |	-  |	-  |	-
P 17|	-  |	L  |	F  |	F  |	F  |	-  |	-  |	-
P 18|	-  |	-  |	L  |	F  |	F  |	F  |	-  |	-
P 19|	-  |	-  |	-  |	L  |	F  |	F  |	F  |	-
P 20|	-  |	-  |	-  |	-  |	L  |	F  |	F  |	F
P 21|	F  |	-  |	-  |	-  |	-  |	L  |	F  |	F
P 22|	F  |	F  |	-  |	-  |	-  |	-  |	L  |	F
P 23|	F  |	F  |	F  |	-  |	-  |	-  |	-  |	L
Each broker node had 12 partitions assigned. We used a replication factor of four because we wanted to mimic the geo redundancy for some of our users, which had certain process execution latency requirements. The geo redundancy introduces network latency into the system by default. We wanted to reduce the influence of such network latency to the process execution latency. To make it a bit more realistic, we used Chaos Mesh to introduce a network latency of 35ms between two brokers, resulting in a round-trip time (RTT) of 70ms.
To run with an evenly distributed partition leadership, we used the partitioning rebalancing API, which Zeebe provides.
Theory
Based on the benchmark process model above, we considered the impact of commands and events on the process model (and also in general).
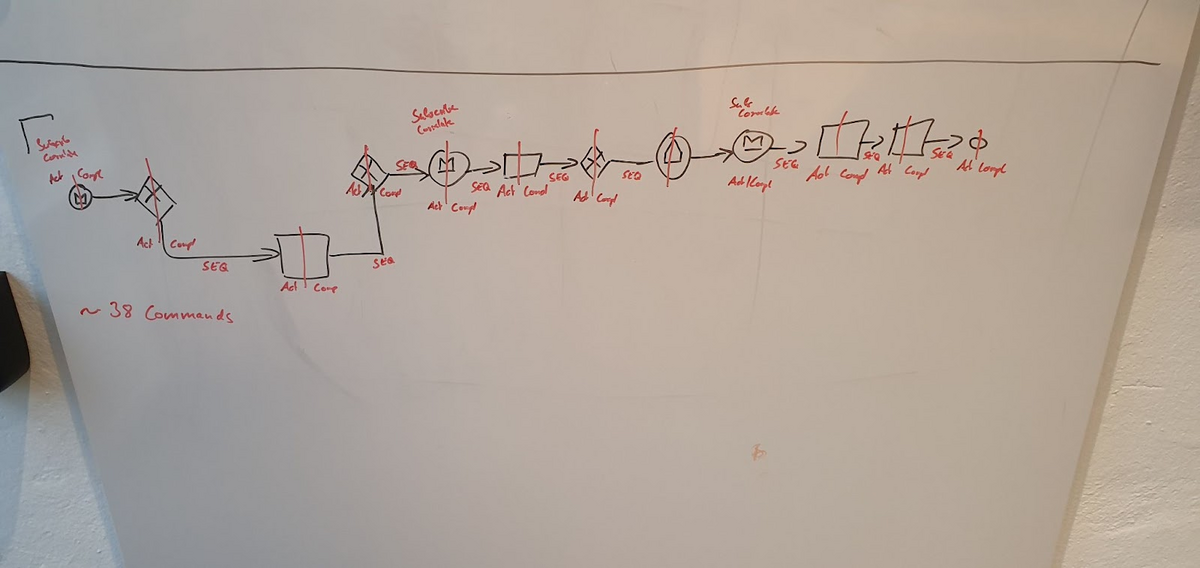
We calculated around 30 commands are necessary to execute the process instance from start to end.
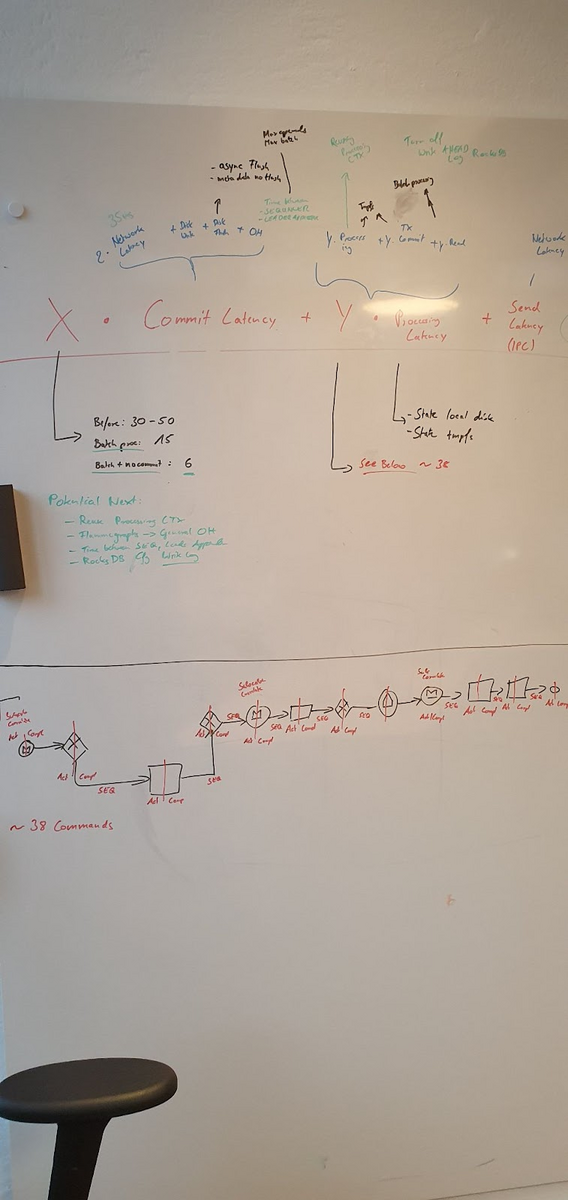
We tried to summarize what affects the processing latency and came to the following formula:
PEL = X * Commit Latency + Y * Processing Latency + OHPEL – Process Execution Latency
OH – Overhead, which we haven’t considered (e.g. Jobs * Job Completion Latency)
When we started, X and Y were equal, but the idea was to change factors. This is why we split them up. The other latencies were based on:
Commit Latency = Network Latency + Append Latency
Network Latency = 2 * request duration
Append Latency = Write to Disk + Flush
Processing Latency = Processing Command (apply state changes) + Commit Transaction (RocksDB) + execute side effects
Below is a picture of our whiteboard session, where we discussed potential influences and what potential solution could mitigate which factor:
Proof of concepts
Based on the formula, it was a bit more clear to us what might affect the process execution latency and where it might make sense to change or reduce time. For example, reducing the append latency affects commit latency and will affect process execution latency. Additionally, reducing the factor of how often commit latency is applied will highly affect the result.
Append and commit latency
Before we started with the performance hackdays, there was one configuration already present which we built more than two years ago and made available via an experimental feature: the disabling of the raft flush. We have seen several users applying it to reach certain performance targets, but it comes with a cost. It is not safe to use it, since on fail-over certain guarantees of raft no longer apply.
As part of the hackdays we were interested in a similar performance, but with more safety. This is the reason why we tried several different other possibilities but also compared that with disabling the flush completely.
Flush improvement
In one of our POC’s, we tried to flush on another thread. This gave a similar performance as with completely disabling it, but it also has similar safety issues. Combining the async flush with awaiting the completion before committing brought back the old performance (base) and the safety. This was no solution.
Implementing a batch flush (flush only after a configured threshold,) having this in a separate thread, and waiting for the completion degraded the performance. However, we again had better safety than with disabling flush.
We thought about flushing async in a batch, without waiting for commit and making this configurable. This would allow users to trade safety versus performance.
Write improvement
We had a deeper look into system calls such as madvise.
Zeebe stores its log in a segmented journal which is memory mapped at runtime. The OS manages what is in memory at any time via the page cache, but does not know the application itself. The madvise system call allows us to provide hints to the OS on when to read/write/evict pages.
The idea was to provide hints to reduce memory churn/page faults and reduce I/O
We tested with MADV_SEQUENTIAL, hinting that we will access the file sequentially and a more aggressive read-ahead should be performed (while previous pages can be dropped sooner).
Based on our benchmarks, we hadn’t seen much difference under low/mid load. However, read IO was greatly reduced under high load. We have seen slightly increased write I/O throughput under high load due to reduced IOPS contention. In general, there was a small improvement only in throughput/latency. Surprisingly, still it showed similar page faults as before.
Reduce transaction commits
Based on our formula above, we can see that the processing latency is affected by the RocksDB write and transaction commit duration. This means reducing one of these could benefit the processing latency.
State directory separation
Zeebe stores the current state (runtime) and snapshots on different folders on disk (under the same parent). When a Zeebe broker restarts, we recreate the state (runtime) every time from a snapshot. This is to avoid having data in the state which might not have been committed yet.
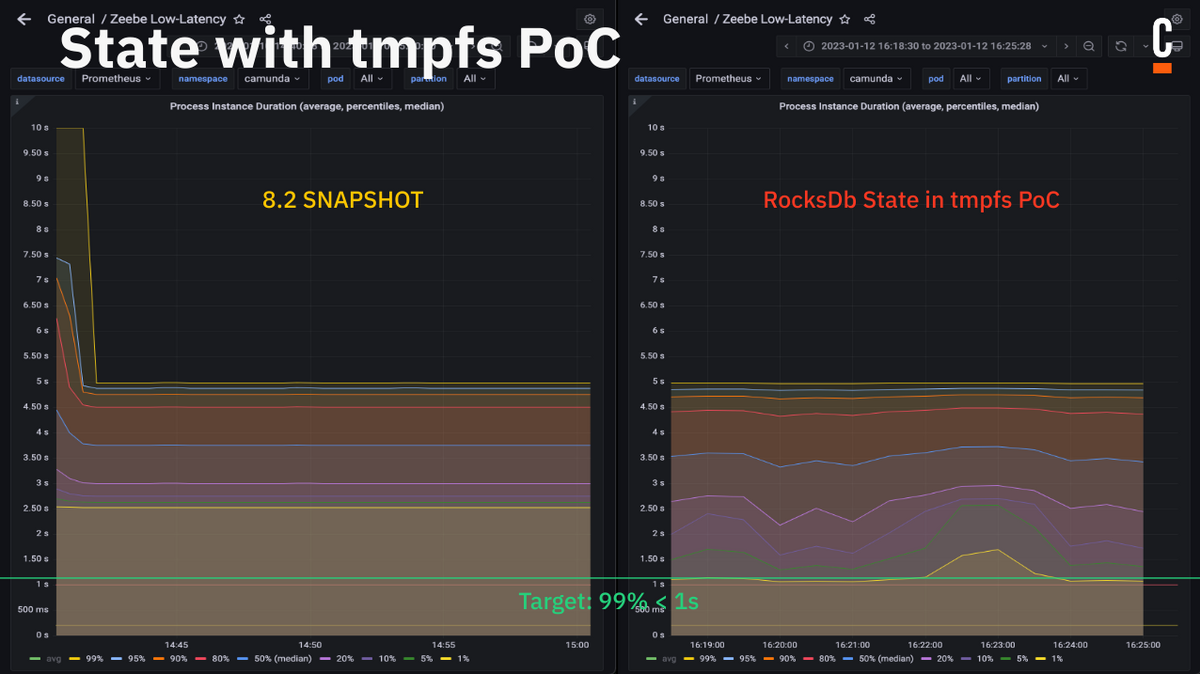
This means we don’t necessarily need to keep the state (runtime) on disk, and RocksDB does a lot of IO-heavy work which might not be necessary. The idea was to separate the state directory in a way that it can be separately mounted (in Kubernetes) such that we can run RocksDB in tmpfs, for example.
Based on our benchmarks, only p30 and lower have been improved with this POC:
Disable WAL
RocksDB has a write-ahead log to be crash resistant. This is not necessary for us to recreate the state every time. We considered disabling it, we will see later in this post what influence it has. It is a single configuration, which is easy to change.
Processing of uncommitted
We mentioned earlier that we have thought about changing the factor of how many commits influence the overall calculation. What if we process commands already, even if they are not committed yet, and only send results to the user if the commit of the commands is done?
We worked on a POC to implement uncommitted processing, but it was a bit more complex than we thought due to the buffering of requests, etc. This is why we didn’t find a good solution during our hackdays. We still ran a benchmark to verify how it would behave:
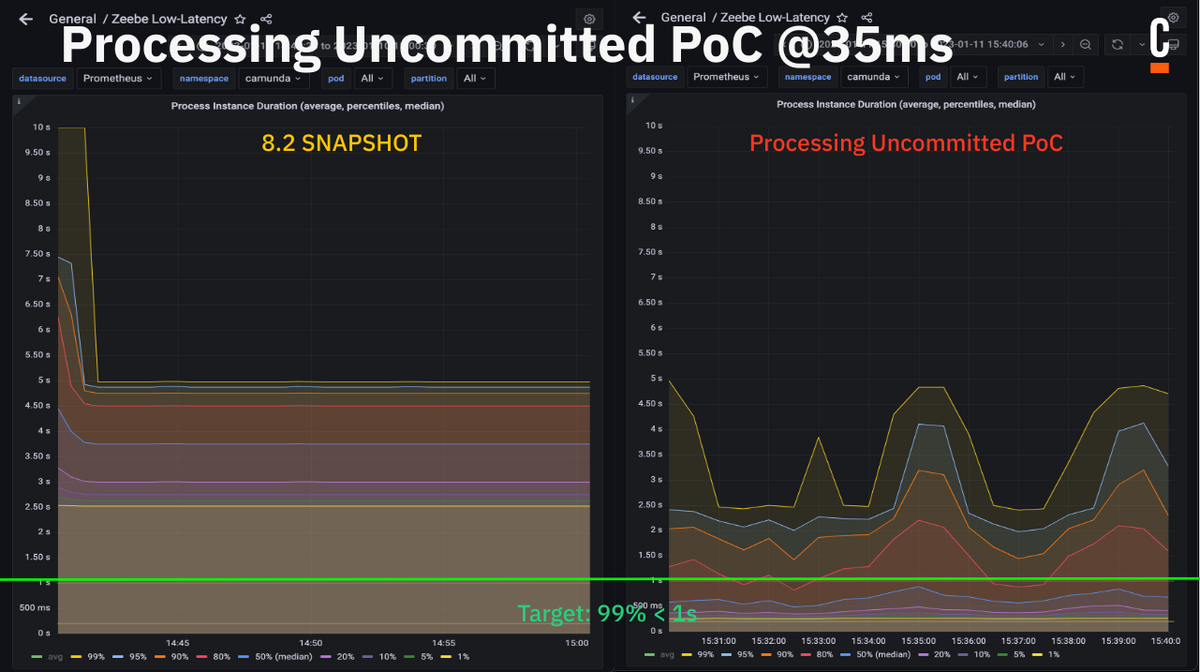
The results were quite interesting and promising, but we considered them a bit too good. The production ready implementation might be different, since we have to consider more edge-cases.
Batch processing
Part of another POC we did was something we called batch processing. The implementation was rather easy.
The idea was to process the follow-up commands directly and continue the execution of an instance until no more follow-up commands are produced. This normally means we have reached a wait state, like a service task. Camunda Platform 7 users will know this behavior, as this is the Camunda Platform 7 default. The result was promising as well:
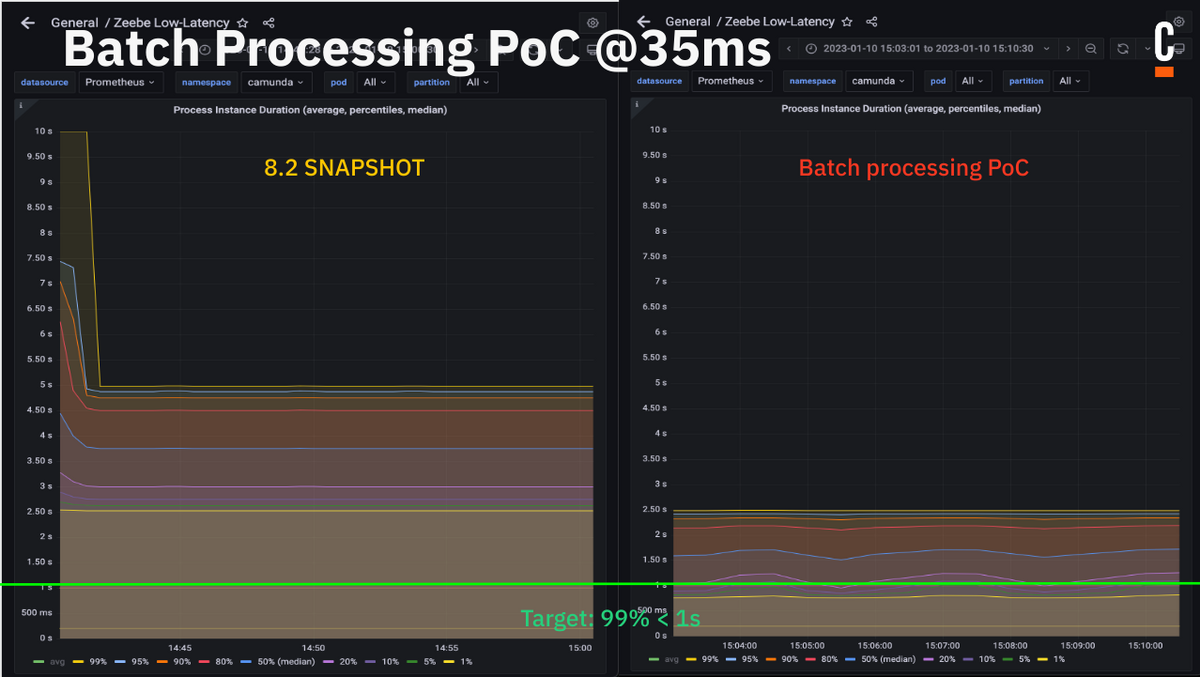
In our example process model above, this would reduce the factor of commit latencies from ~30 commands to 15, which is significant. The best IO you can do, however, is no IO.
Combining the POCs
By combining several POCs, we reached our target line which showed us that it is possible and gave us some good insights on where to invest in order to improve our system further in the future.
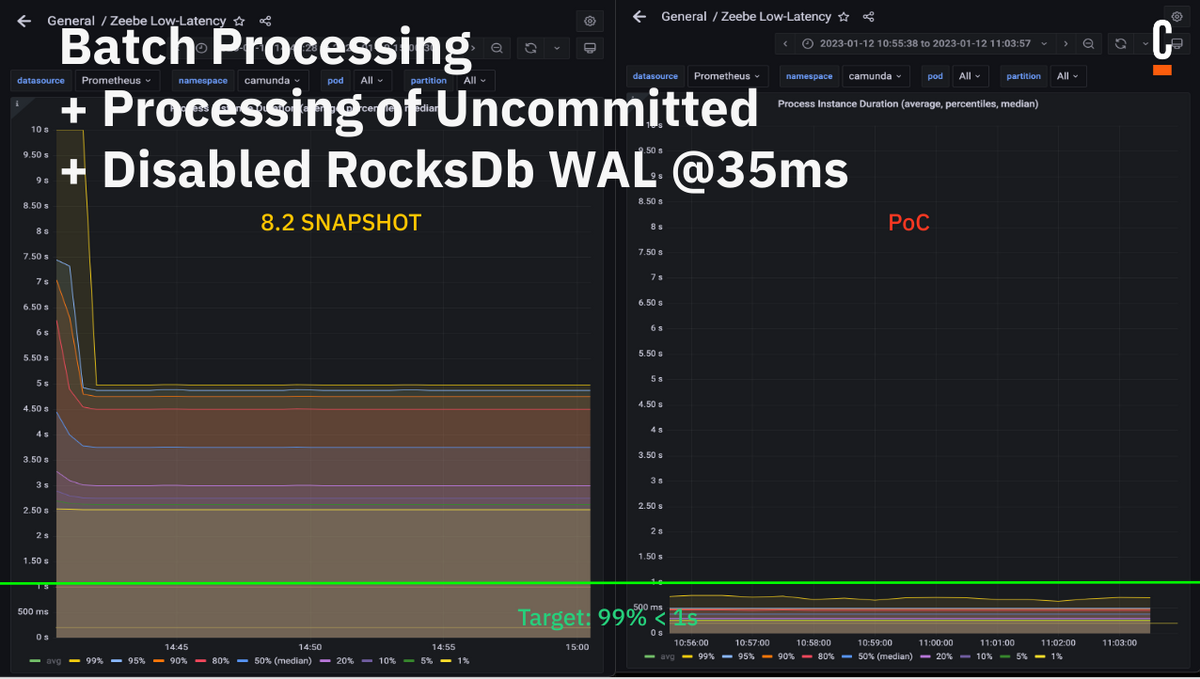
The improvements did not just improve overall latency of the system. In our weekly benchmarks we had to increase the load because the system was able to reach higher throughput. Before we reached ~133 (on avg) process instances per second (PI/s) over three partitions, now 163 PI/s (on avg) while also reducing the latency by a factor of 2.
Next
In the last weeks, we took several ideas from the hackdays to implement some production-ready solutions for Zeebe 8.2. For example:
- Disabling WAL per default
- Implement batch processing
- Make disabling raft flush more safe
- Direct message correlation on the same partition
We plan to work on some more like:
You can expect some better performance with the 8.2 release; I’m really looking forward to April! 🙂
Thanks to all participants of the hackdays for the great and fun collaboration, and to our manager (Sebastian Bathke) who made this possible. It was a really nice experience.
Participants (alphabetically sorted):
- Christopher Kujawa (myself)
- Deepthi Devaki Akkoorath
- Falko Menge
- Nicolas Pepin-Perreault
- Ole Schönburg
- Roman Smirnov
- Sebastian Bathke
Thanks to all the reviewers of this blog post: Christina Ausley, Deepthi Devaki Akkoorath, Nicolas Pepin-Perreault, Ole Schönburg, Philipp Ossler and Sebastian Bathke
