Companies cannot compete in today’s economy without a deep understanding of how their products and services are used, what products sell better than others—where and to whom, if any products have defects or issues, if a new product or service is warranted, and more. Gathering these insights will help your organization be proactive and anticipate changes before they hurt the organization.
In most cases, companies have teams or departments devoted to obtaining data from a wide range of sources and running business analytics to extract key insights to maintain market share and gain new customers. These departments may use visualization tools such as Tableau or PowerBI and others may write sophisticated machine learning models using packages for R or Python. Whichever approach you choose, there is no questioning that analytics provide powerful insights into your business.
Stay tuned for more blogs around analytics and Camunda coming this spring.
Getting started with analytics and Camunda
What if you could include the details about your internal and external Camunda processes as sources to be analyzed so you can optimize your Service Level Agreements (SLAs) and Key Performance Metrics (KPIs) so you can have a more holistic view of what is involved in your business and how to make optimal improvements?
Using business processes in combination with your existing artificial intelligence (AI) and machine learning (ML) algorithms will help you consolidate and transform your data to make real-time predictions and analysis with a more comprehensive perspective of your business. Having this insight allows you to review your process key performance indicators (PKIs) and continuously improve them.
Camunda’s ML-ready datasets
Camunda can help get you started by providing ML-ready datasets for use with your data analysis tools and models. These datasets serve as an additional source to provide more information that can be used when reviewing trends, predictions, and other observations to improve your models and business insights.
But you don’t have to include this data as an additional source, you can also use it alone. Importing this data can help you predict outcomes from individual processes as well. Although you can gain significant insight by reviewing the process analytics in Camunda Optimize, you can still use the dataset as a source for your code or tools.
What is an ML-ready dataset?
Camunda Optimize can export an ML-ready dataset in CSV format that can be used as an additional source for your business analytic tools and models. For more information on how to obtain this dataset, check out our previous blog AI Powered Process Optimization ML-Ready Dataset.
The ML-ready dataset from Camunda provides a broad range of process variables and data extracted from your Camunda process instances. The key to a successful understanding of your ML-ready dataset can be how you name your tasks, events, and gateways as this information is used to name the variables that are gathered in the dataset.
Below is a snapshot of data captured by Camunda Optimize in the ML-ready dataset from an automobile claims process. Some of the data captured is reflective of the process variables, gateway names, task names, etc. that you define and others are system variables.
Variables in ML-ready dataset from Optimize
Process Instance SpecificprocessDefinitionKey
processDefinitionId
processInstanceId
businessKey
startDate
endDate
duration
engineName
tenantIdFlow Node DurationflowNodeDuration:CallActivity_claimAdjuster
flowNodeDuration:Task_notifyWithAdjuster
flowNodeDuration:Task_verifyPolicyInformation
flowNodeDuration:Gateway_join
flowNodeDuration:Task_scheduleAdjuster
flowNodeDuration:Task_generateClaimNumber
flowNodeDuration:Gateway_injury
flowNodeDuration:Task_reviewMedicalInformation
flowNodeDuration:Event_claimPaid
flowNodeDuration:Task_notifyMedicalReview
flowNodeDuration:Task_enterClaim
flowNodeDuration:Task_notifyPaymentSent
flowNodeDuration:Event_0lwofnq
flowNodeDuration:Task_smsClaimAccepted
flowNodeDuration:StartEvent_claimRequestReceived
flowNodeDuration:Gateway_validPolicy
flowNodeDuration:Gateway_medicalReviewDurationdur:Activity_00aucj3
dur:CallActivity_claimAdjuster
dur:Event_claimPaid
dur:Event_0lwofnq
dur:Gateway_injury
dur:Gateway_join
dur:Gateway_medicalReview
dur:Gateway_0shre7n
dur:Gateway_validPolicy
dur:StartEvent_claimRequestReceived
dur:Task_enterClaim
dur:Task_generateClaimNumber
dur:Task_notifyMedicalReview
dur:Task_notifyPaymentSent
dur:Task_notifyWithAdjuster
dur:Task_reviewMedicalInformation
dur:Task_scheduleAdjuster
dur:Task_smsClaimAccepted
dur:Task_verifyPolicyInformationCountscount:incidents
count:openIncidents
count:userTasksProcess variablesvariable:VIN
variable:aID
variable:accidentDate
variable:accidentDescription
variable:accidentLocation
variable:adjusterDocId
variable:adjusterDocUrl
variable:adjusterEmail
variable:adjusterName
variable:adjusterNumber
variable:adjusterPhone
variable:adjusterSlack
variable:carClass
variable:city
variable:claimNumber
variable:claimStatus
variable:connectionTimeoutInSeconds
variable:estimate
variable:estimateComments
variable:injuryDescription
variable:injuryFlag
variable:itemId
variable:medReviewComments
variable:medicalEstimate
variable:medicalRecordsLink
variable:method
variable:methodOfPayment
variable:openAiResponse
variable:paymentApproval
variable:policyNumber
variable:policyVerified
variable:policyholderAddress
variable:policyholderCity
variable:policyholderEmail
variable:policyholderName
variable:policyholderPhone
variable:policyholderState
variable:state
Variable:url
variable:vehicleMake
variable:zipThese types of variables are defined in your BPMN diagram and are often used for decision-making or passing information to/from other systems. In most cases, the “system of record” maintains these values; such as, policy system, customer relationship management system, etc.
As you can see, some variables deal with duration (prefixes “dur:” and “flownodeDuration:”) for certain components of the flow and the overall duration (“duration”) of the individual process. Each variable for this specific process has a prefix of “variable:”. These are often the variables that are passed to and from external applications or systems.
The ML-ready dataset is exported in comma-separated value (CSV) format which can be used as an input source to most data science programming languages as well as applications and tools.
Keeping your data source up to date
As part of using the Camunda ML-ready export for your in-house analytics, you may want to set up a repeatable export—like a daily or weekly basis—so that you are keeping the source data up to date with new processes in your Camunda environment. These exports can be housed in your data warehouse. However, this step is not necessary.
Let’s take a look at how you can take advantage of this data within your organization.
What can I do with this information?
With this information from your Camunda orchestrations, you can start by improving your processes by reviewing bottlenecks, branches rarely taken, tasks never completed, overall duration of the process, individual task duration, and more. Camunda provides many out-of-the-box reports and dashboards for this purpose with Optimize.
However, you may want to take a deeper look at your processes along with other data within your organization to get a better understanding of what products are successful if claims processing can be carried out more efficiently, if there are any upward or downward buying trends within the organization, etc.
Using process analytics for business intelligence
Several tools and applications allow you to select CSV and Excel source data—for example, Tableau and PowerBI. Keep in mind that Camunda Optimize provides the ability to create a wide range of reports, visualizations, and dashboards to gain a better understanding of how your process is performing.
By taking a look at the data provided by the Optimize ML-ready dataset, you can start to review your process and see what has been happening in your process. This includes things like the most traveled branches and which tasks take the longest.


Having a handle on this information leads to seeing certain repeatable trends in your data. However, this may not provide you with all the information needed to see these trends or to make predictions about them. In that case, you may want to include additional data within your organization to provide a 360° view of how your products and services are performing.
The following example might help you visualize some analytics including your process orchestration information.
A business scenario for analytics
Let’s look at a scenario around a fictitious Property and Casualty (P&C) Insurance company called Camundanzia that is reviewing the need to offer a different layer to the existing policy types or riders for drivers who meet specific criteria or discounts for those who do not.
Camundanzia has started to notice that it takes much longer to estimate repairs on certain vehicles and that more claims are made by drivers in specific age categories and areas of the country where they offer insurance. They want to take a deeper look and see if these are valid assumptions and what the data tells them.
So, Camundanzia determines there is a list of questions that they want to confirm by looking at the data from their claims process to help determine if claims processing is more time-consuming or difficult for insured drivers under a specific age driving cars that fall into multiple high-end car classes in specific geographical areas.
- Which tasks in the claims process take the most time?
- Does claim processing take longer with younger drivers in high-end cars?
- Is the time required for claim processing affected by the driver’s age?
- Is the time required for claim processing affected by the car class/vehicle type?
- Is the time required for claim processing affected by the driver’s geographical area?
- Does the weather on the day of the accident affect the time required to process the claim?
Based on the answers to these questions, Camundanzia plans to evaluate if a policy rider is required for drivers under a certain age with cars in the designated classes as well as if additional training of the staff or changes to the process to route specific claims to a specialized staff for handling is needed.
In this example scenario, you are a member of Camundanzia’s data analytics team and will be using this background to study the data.
Getting Started
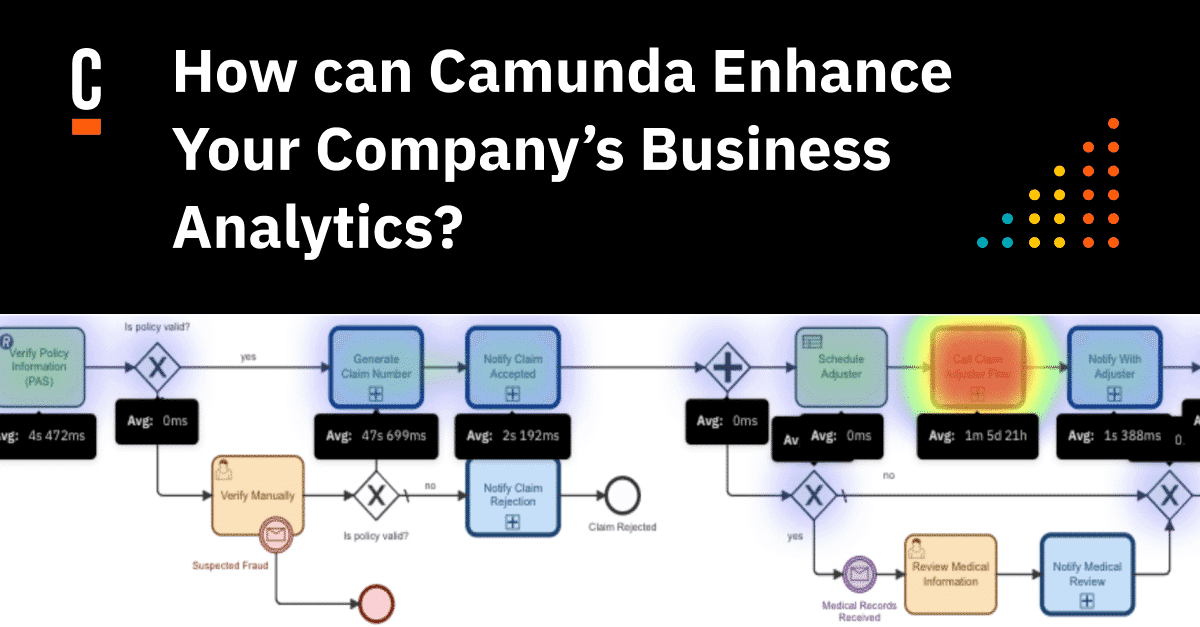
In our example, Camundanzia’s claims process looks like the diagram represented below.

You start by running some of the out-of-the-box reports provided by Camunda Optimize before extracting data and using your data analysis tools to review the data. In this case, you are reviewing how many claims were received by vehicle type.

This helps to show where claims are taking the longest time to complete.

Using these initial visualizations can help you direct some of the focus for your analytics for your specific questions and analysis.
Using Camunda’s ML-ready dataset outside of Optimize
First, you will want to extract an ML-ready dataset from our Camunda environment and make sure that you have access to any other pertinent data that has information that can be used to help answer the questions.
Visualizing with Tableau or PowerBI
You might want to do some initial analysis on the Camunda data before loading other data into your models. For example, this is a representation of claims in certain states by vehicle type represented in PowerBI.

You can see here that claims for Volkswagons in Texas (TX) take longer to process than other vehicle types in the other states represented. You can also see that Fords take the longest to process through claims in Pennsylvania (PA).

Taking a deeper look, you can see that the time the claim takes with the adjuster doing the repair estimate takes significantly longer on Bentleys in the state of California when reviewing only higher priced vehicles.

Now that you have a bit of insight into the data, you can take it a step further combining this data with your different company and demographic data to review the questions you want to answer to determine if a new product offering or rider for certain drivers with certain car types.
Data analysis by combining other datasets
As demonstrated, in our example, not all the information needed can be found in the ML-ready Camunda dataset. However, you were able to review the claim duration which tasks take longer, and some initial views of the data. But in your case, you are missing key information like the driver’s age and weather conditions to help you gain more insights into your data.
By accessing your claim system and policy system along with weather data for the geographical area on the date of the accident, you have collected another data source that provides information for your deeper analysis. In this case, we have joined or matched this dataset with the Camunda process data on the claim number.
Initial visualization of the external data set
First, you decide that you want to run some visualizations to better understand your drivers in the pool of information you have collected. In this case, we are looking at the disbursement of driver age and car class (as well as what the weather conditions were on the day of the accident. This is done independent of the claims processing data.

By reviewing the distribution by driver age and reviewing the weather conditions, we can determine if we have the right type of data and information we need to determine if your assumptions hold weight and if additional analysis is merited.
Regression and other analysis
You want to see if there is some correlation between the claim duration and various driver ages and accident details. As before, a visualization plot can help you see if there are outliers in your data or trends to be investigated.

However, this doesn’t yield much definitive information, so you decide to run some models to help you make a better determination. In this case, you have decided to run multilinear regression. You start with statsmodels in Python using the least squares method on your merged pandas dataframe to reveal if there is some relationship.

In this example, our dependent variable is the duration of the entire claims process for the claim. For independent variables, we have used:
- Weather conditions
- Car Make
- State
- Driver Age
Let’s start with the R2 value which is not very strong with a value of 0.318 which indicates that 31.8% of the claim duration can be explained when our independent variables change.
Next, we want to check the P>|t| value which indicates how strongly an independent variable value influences the duration dependent variable. A p-value of 0.05 or 0.10 is common to indicate a strong influence. The variable name followed by [T.value] indicates categorical variables and the model shows what value from the list shows some influence. The lower the p-value, the better to indicate the variable matters in your model.
You can see here the following variable values affect the overall claim duration:
state[T.PA]with a value of 0.026car_make[T.Bentley]with a value of 0.000weather_conditions[T.Sunny]with a value of 0.007
As you saw earlier, there may be a few outliers that could throw our model off, but it does seem that some of the claim specifics do indicate how long it takes to process the claim. However, the driver’s age is not one of them with a value of 0.670.
You can also review the coefficients and intercept in the model. Remember that regression is building a formula which is the duration as a combination of intercepts and coefficients similar to y = mx + b, but with multiple “x” values.
Be sure to check the signs of the coefficients, for example, having Sunny conditions reduces the total claim duration indicated by the negative coefficient for weather_conditions[T.Sunny]. This is the opposite of driving a Bentley which will add to total claim processing with a positive coefficient.
Although you do not see any real correlation between total claim duration and driver age, you determine to test that by modeling.
So, you subset the data frame to provide only those claims with a driver 30 years or younger. You do some similar visualizations to review the data. You can see here that the majority of drivers in your data set are between 20 and 30 with the most closer to 20.

Then you run the same least squares regression on this merged data to review the results of claims processing duration and the correlation when a driver is young.

Although the R2 is really strong, it is an improvement over the all ages model with a value of 0.408. This seems to indicate that the driver age might have some influence on how long it takes to process the claim.
Again, you review the p-values and see that none of the variables are of significance with the smallest values for Sunny weather conditions (0.109) and driving a Bentley (0.064). We also notice again the Sunny conditions reduce the total claim duration and driving a Bentley increases it.
Looking at task duration
The same exercises can be done reviewing the certain tasks that take longer, such as the claimAdjuster task. As shown below, the R2 value is decreased and the state of PA is still significant, but driving a Bentley is not when reviewing the adjuster task duration.

If we only use the R2 information, we might want to conclude that there is no correlation between a driver’s age, weather conditions, type of car, and geographical location on how long it takes to process a claim or do an estimate. However, you did find some independent variables that influence the claim and task durations.
Of course, this is just an example with fabricated data and does not go deep into other modeling techniques.
What does this mean?
Although fictitious data was used in this example, you can see that taking components of the Camunda process data and combining that with other data within your organization to gain true insight into your process efficiency and other insights. With the ML-ready dataset provided by Camunda Optimize, you can gain a deeper understanding of how your process and other data affect your outcomes and continuously improve your business processes as a result.
This is only one example of how you might combine Camunda process data and other collected data from other systems to do data analysis. For example, you can use historical data from your processes to train models so that you can predict future performance of your processes. You can also review processes where customers might have freeform areas to provide feedback and perform various natural language processing (NLP) models, such as sentiment analysis, to determine if certain products or applications might be better received than other.
It’s really up to you. As shown, the data stored by Camunda is valuable in gaining insights into your processes and your business.
Be sure to stay tuned for our next blog post about making business decisions by adding Camunda ML-ready data to your data analytics.
Take a test drive
Sign up for a Camunda Starter plan today and get started with a 30-day free trial!
Already have a trial? Upgrade to Starter today
If you already have a trial and want to continue with the capabilities of the Starter plan, you can ensure a smooth transition by upgrading today.


