
Running Camunda in production is rarely an isolated activity. Camunda clusters sit alongside application services, databases, message brokers, and cloud infrastructure, all of which are already monitored using established observability tools. For most teams, operational confidence depends on seeing these signals together, in one place.
Until now, Camunda 8 SaaS customers did not have a supported way to consume Camunda’s application-level metrics in their own monitoring systems. Internal dashboards were deliberately kept private, and while some customers accessed temporary or experimental endpoints, these approaches were not designed for long-term use.
With the Cluster Metrics endpoint, Camunda introduces a supported and secure way to integrate Camunda 8 SaaS metrics into your existing observability stack for all Camunda 8 SaaS clusters.
Observability that fits how teams already operate
Most Camunda customers already rely on Prometheus-compatible tooling, whether that is Prometheus itself, Grafana Agent, or platforms such as Datadog. In previous Camunda releases, this was out of reach because there was no direct access to Camunda metrics for alerting, correlation, and root-cause analysis alongside the rest of the estate.
The Cluster Metrics endpoint closes this gap by exposing a dedicated metrics endpoint for each cluster providing Prometheus-formatted metrics and is scoped strictly to the customer’s own cluster namespace. This means teams can monitor Camunda using the same processes and standards already applied to their other production systems, without needing to understand Camunda’s internal platform topology or depend on Camunda-managed dashboards.
Secure by default, managed in the Console
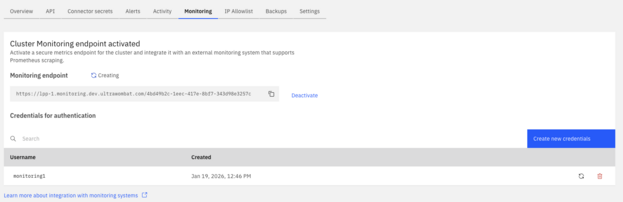
You configure the Cluster Metrics endpoint directly in the Camunda Console. Once enabled, Camunda provisions a secure metrics endpoint for the selected cluster. Access is protected using basic authentication, with credentials generated and managed in the Console. Credentials can be rotated at any time, and old credentials are invalidated automatically.
To further restrict access, you can use the existing IP Allow list feature to restrict access to the Camunda cluster’s monitoring endpoint. Only traffic from these approved addresses can reach the metrics endpoint. If Cluster Metrics Access is disabled, the endpoint is removed and becomes unavailable, preventing lingering exposure.
This approach keeps the customer in control while ensuring that Camunda fully manages the underlying infrastructure.
Using Cluster Metrics Access with Prometheus
Step 1: Activate the Cluster Metrics endpoint in the cluster settings

Create first user credentials that will be used to access this endpoint.

Copy the generated password and save it for the next steps.

Wait for the Monitoring endpoint to reach ready state and take a note of the Monitoring endpoint URL and orchestration cluster ID.
Step 2: Integrate with Prometheus
Once you’ve enabled Cluster Metrics Access, integrating with Prometheus is straightforward. The endpoint behaves like any other HTTPS scrape target and can be added to an existing Prometheus configuration using Basic Auth credentials as shown below.
Note that the monitoring endpoint provided in a previous step should be split in the server name <c8-location-code>.monitoring.camunda.io used as target, and clusterid used in metrics_path.
scrape_configs:
  - job_name: c8-cluster
    scheme: https
    metrics_path: /<cluster-id>
    basic_auth:
      username: "<MONITORING_USERNAME>"
      password: "<MONITORING_PASSWORD>"
    static_configs:
      - targets:
          - <c8-location-code>.monitoring.camunda.io
    scrape_interval: 30s
    scrape_timeout: 5s
After this is in place, Camunda metrics appear alongside other monitored services. Teams can define alerts, build dashboards, or ingest the metrics to downstream systems, such as Datadog, without special handling.
Step 3: Create an example Camunda dashboard
Camunda accelerates onboarding with a prebuilt Grafana dashboard you can import directly from this GitHub repository. It highlights key performance indicators (KPIs) and metrics for each supported Camunda version.
The dashboards are intended as a reference rather than for production use and may rely on metrics from additional sources such as kube-state-metrics and node-exporter. Customers are free to adapt the dashboards to their own conventions and operational needs. Note that metric sets may vary between Camunda versions.
You should expect to see something similar to the image below when using this example.

Feel free to use these dashboards as an example and integrate Camunda Orchestrations cluster metrics with your application monitoring systems.
Clear boundaries and expectations
The Cluster Metrics endpoint is designed to provide visibility without exposing the internal platform details. It does not provide access to Camunda-managed Grafana and does not support push-based metric delivery. It does emit the metrics aligned with a specific cluster version with the proper authentication. Authentication at general availability uses basic authentication.
These boundaries enable Camunda to provide reliable access to operational metrics while maintaining platform isolation and ensuring long-term maintainability.
Availability
The Cluster Metrics endpoint is now available for all Camunda 8 SaaS clusters, with no upgrade required. The Cluster Metrics endpoint enables teams to observe Camunda in the same way they observe the rest of their systems—using familiar tools, consistent workflows, and clear security controls.
For detailed configuration steps and access to the sample Grafana dashboard, visit the Camunda documentation or open the Camunda Console for your cluster.
Start the discussion at forum.camunda.io