We are happy to announce the release of Camunda Optimize version 2.3.0-alpha1. You can find many improvements and features of the upcoming Optimize version 2.3.0 in this first alpha release:
- A completely redesigned Analysis page to help you to better make sense of the information provided on this page.
- The ability to delete old data with the history cleanup feature in order to keep the database size small.
- Warnings when a change you make to a report causes this report to no longer be qualified for alerts or combined reports.
- Speaking of combined reports: it is now possible to combine single-number reports to see them all next to each other in a bar chart.
- When you upgrade Optimize to a new version, the current progress of the upgrade is now displayed.
- Finally, we created some examples for common use cases of the variable filter plugin mechanism of Optimize.
The complete release notes are available in Jira.
You can try out a free trial of Camunda Optimize.
New Analysis Page UI

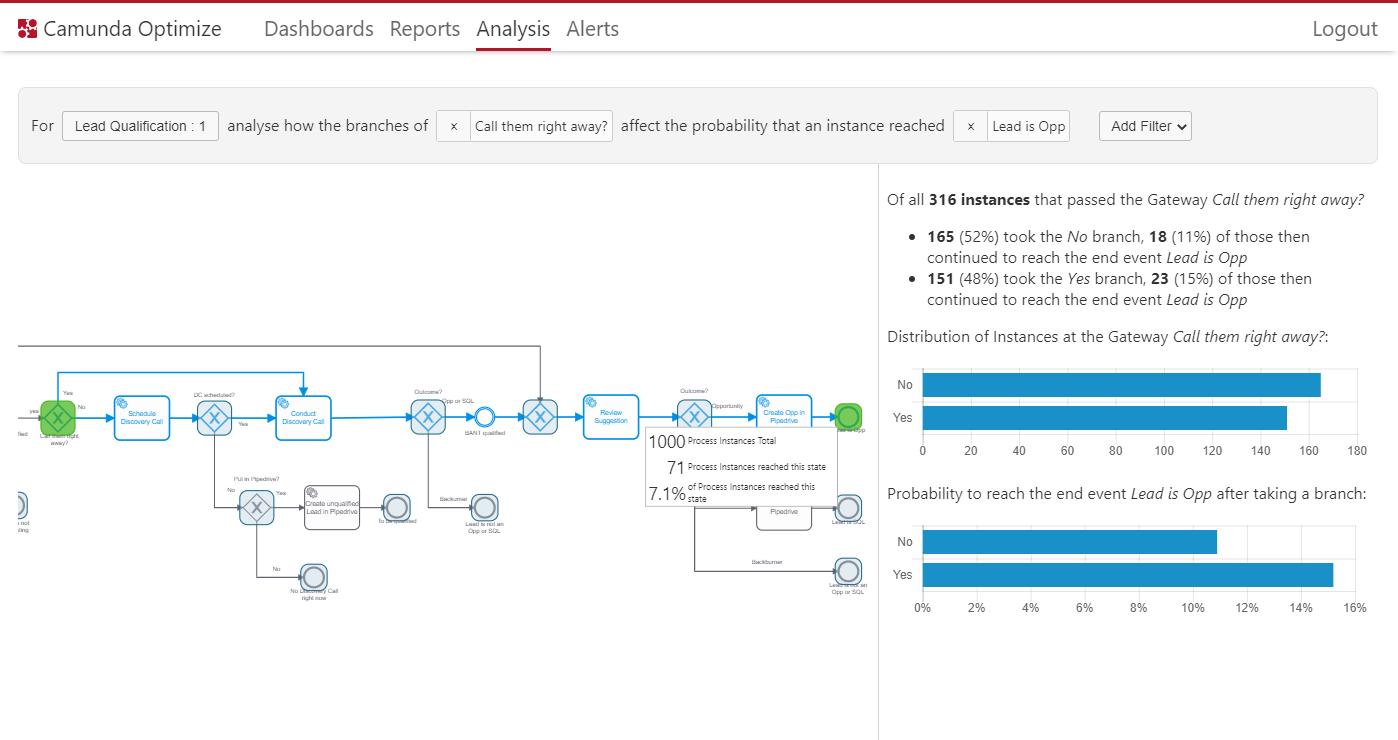
If a process contains more than one end event, it is useful to know which path tokens take when they get to an end event. Camunda Optimize can show you a statistical analysis for a given end event and a gateway. This analysis includes how tokens were split at the gateway in question and how many of the tokens of each branch reached the end event.
In this release, we improved the usability of the analysis page by providing more information in the control panel of the page as well as giving a textual summary of the result. With these changes, the information is much clearer and easier to understand.
History Cleanup
In order to satisfy data protection laws or just for general storage management purposes, Optimize now provides an automated cleanup functionality.
The cleanup is performed based on process instance data. The criteria to decide about whether an instance is to be cleaned up is based on its end date and the configured time to live period (ttl). There is a global ttl as well as the possibility to configure process definition-specific ttls. The cleanup has two different cleanup modes: one that completely deletes the process instance ('all') and another that only clears out the variables of the process instance but keeps the instance itself ('variables'). Same as the ttl, the mode can be overridden for specific process definitions.
By default, the cleanup is disabled to prevent unintended data loss. The details of its configuration are explained thoroughly in a dedicated History Cleanup section in the Optimize Technical Guide.
Warning when changing a report affects other resources
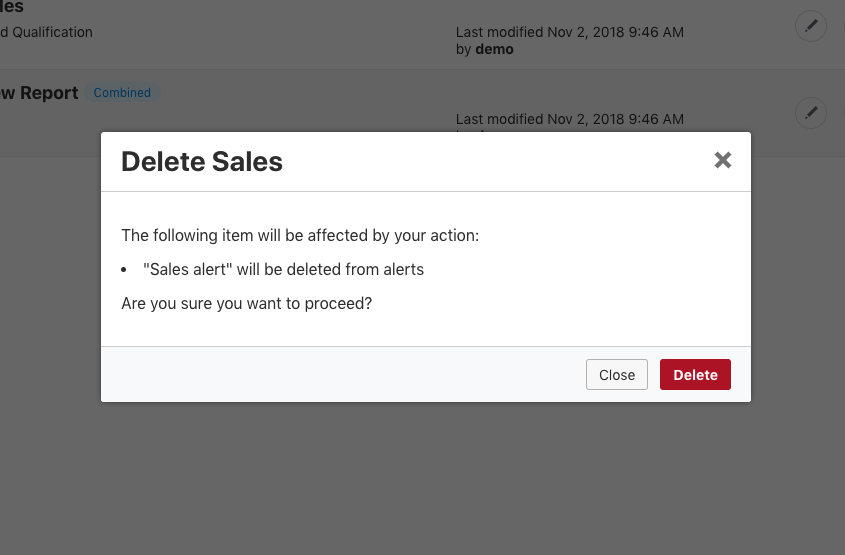
Deleting or updating a report in Optimize may also affect other resources that use that report. For example, deleting or updating a report that is included in an alert will require deleting that alert. In order to keep the user updated on what has changed, we added a warning confirmation message. This confirmation message will appear once the user performs an operation on a report that is used by another resource (dashboard, alert, or combined report). The confirmation message will show the user the changes that will happen to the affected resources and ask the user whether to proceed with the operation or cancel it as shown in the figure below:

Combine single number reports
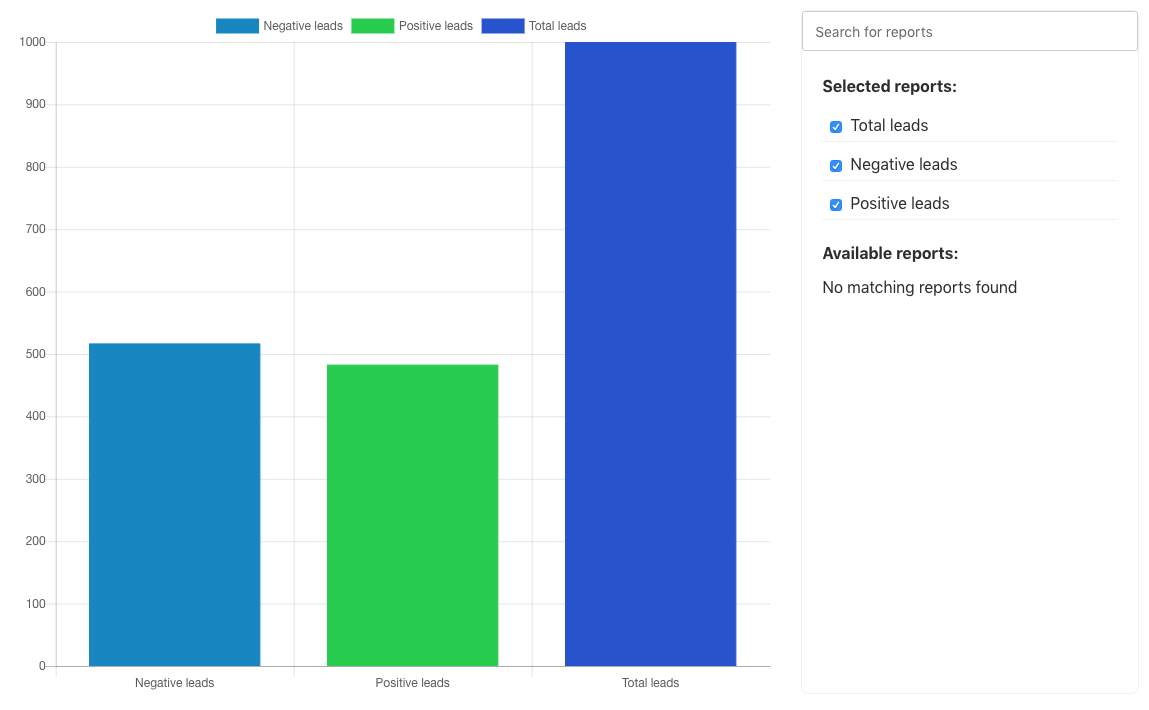
Combining reports in Optimize is a powerful feature that allows you to compare the results of multiple reports together in one visualization. In previous releases, we added the ability to combine bar charts, line charts, and table reports. This release allows you to also combine reports with number visualization. Combining multiple number reports will result in a bar chart containing a single bar for each report.
To illustrate this new feature, let’s use an example: assume we track the sales lead count. Now, we don’t want to see all the leads in aggregate, but rather, we want to compare them based on the leads results. An example diagram could look like the following:

Version Upgrade Progress
To increase the visibility and responsiveness of the upgrade process, the upgrade utility now outputs information on the total number of steps to execute, the number of the current step, and the progress for each single step as percentage.
Starting step 1/12: AddFieldStep
Reindexing from optimize-process-instance-temp to optimize-process-instance, progress: 0%
Reindexing from optimize-process-instance-temp to optimize-process-instance, progress: 69%
Reindexing from optimize-process-instance-temp to optimize-process-instance, progress: 100%
Successfully finished step 1/12: AddFieldStep
...
Starting step 11/12: UpdateDataStep
Successfully finished step 11/12: UpdateDataStep
Starting step 12/12: UpdateDataStep
Finished upgrade successfully!
Examples of variable filter plugins
Optimize is very convenient in the sense that it does all the hard work for you: just configure the connection to the Camunda Engine and
Optimize imports all the data. Sometimes you need to adjust the import to meet your own needs.
This is where the variable filter system is the right tool, because it allows you to hook into the import pipeline and adjust the variable
import to your needs. You can read all the details of how you implement one yourself in the Optimize Plugin System documentation.
Although you can already read documentation on how to implement a plugin, it was sometimes hard to get started or find a way to use
the plugin system for certain use cases. To help you with that we created an Optimize example repository
which contains a collection of usage examples to quickly get you started.
If there is an example that you would like to be added there and that you think other users might benefit from, too, feel free to provide a pull request anytime.
How to get it
If you want to give the new Camunda Optimize a try, you can download the release with your Enterprise customer credentials. Please sign up for a free 30-day trial version.
If you’re new to Optimize, we recommend that you watch the Getting Started with Optimize in less than 5 Minutes video.
