
We’re excited to announce the release of Camunda Optimize 3.5.0.
Camunda Optimize provides business activity monitoring for workflows, supporting continuous process improvement by providing transparency into your automated workflows and decisions. Business-friendly reports, dashboards and alerts make it possible to identify process bottlenecks and improve end-to-end processes.
If you’d like to get started with Optimize 3.5.0 right away, you can download the release here with your Camunda Enterprise Platform customer credentials.
And if you’re not yet a Camunda customer, you can sign up here for a free 30-day trial of the Camunda Enterprise Platform, which includes Camunda Optimize.
Optimize 3.5.0 is again a very special release for us: Besides all the great new additions to Optimize (which you can read about below) we are adding beta support for Optimize in Camunda Cloud. Read more about it in our Camunda Cloud 1.1 Release Blogpost.
In the rest of this post, we’ll highlight some of the new capabilities introduced in Optimize 3.5.0.
- Multi Process Reports
- Bulk delete for Optimize entities
- Default values for Dashboard Filters
- Sum aggregation for Duration Measurement Reports
- Apply Identity Flow Node Filters to Flow Node Reports
- Duration of running Process Instances in Raw Data Reports
- Report Embedding Improvements
- Elasticsearch headers plugin
Multi Process Reports
You can now analyze data from multiple Process Definitions in a single report.
With this release, you can create reports that contain multiple processes. This allows you to get quick overviews, for example across all open user tasks for a set of processes. Previously this was possible by using combined reports, but there were limitations and a lot of useful information is not available in combined reports.
Using the new multi-process reports, all options of the report builder are at your disposal to get the information you need, with all instances across the selected processes collected and considered when building the report according to your specification.
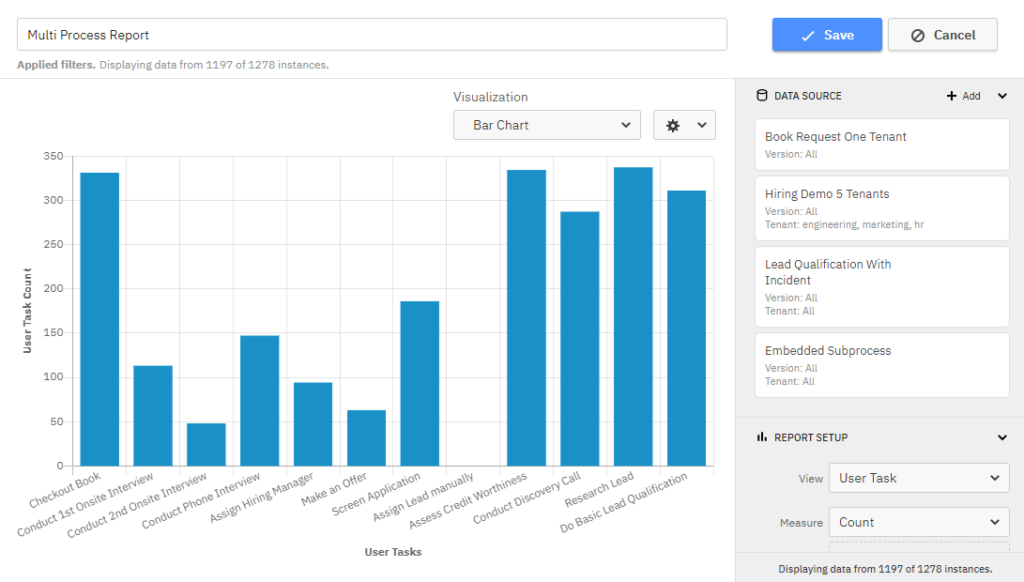
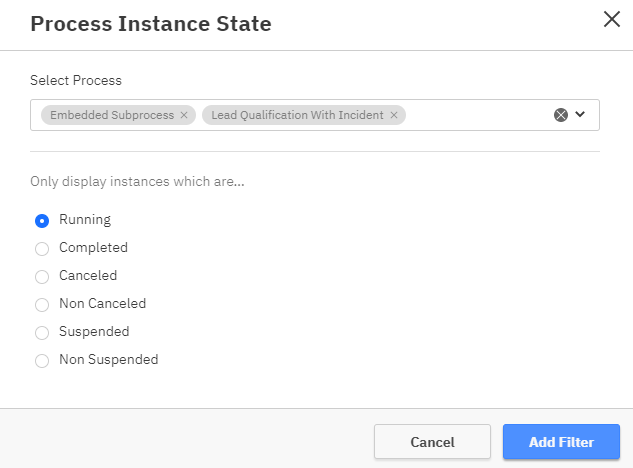
Of course you still have fine-grained control over what information you want to see in the report. For that, we extended the filter functionality to give you control over instances that belong to specific processes. Want to have three different processes in the report, but only the running instances for two of them? No problem with the new filter options.
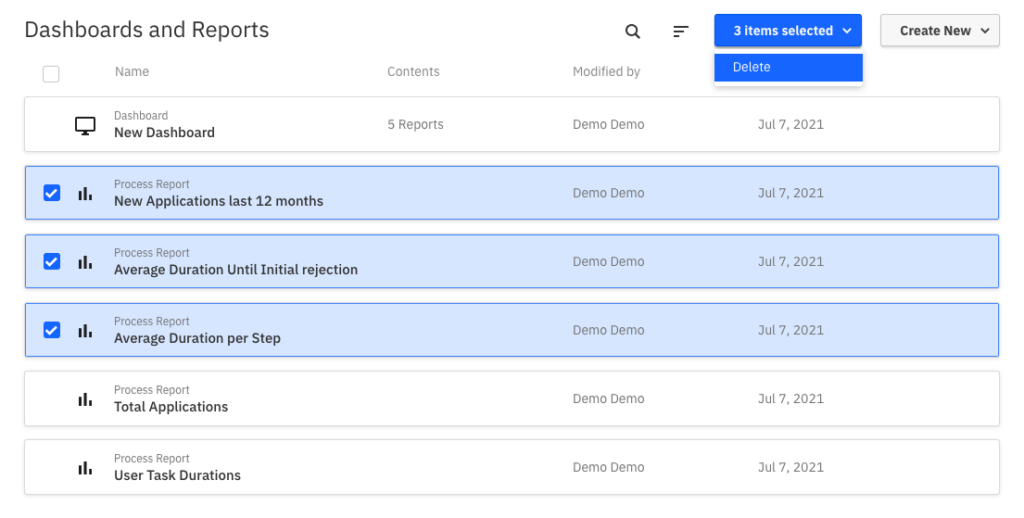
Bulk Delete for Optimize entities
Cleanup multiple list entries at once.
How many of your Reports and dashboards are outdated? We know, things change — certain items are created temporarily or used for testing and you do not want them to stay forever. As you use Optimize, the number of outdated entities grows and it takes time out of your busy day to delete them. We can help.
With this release, we added the possibility to bulk delete items. Here’s what you need to know:
Bulk Delete is available on all Optimize entities, including Reports, Dashboards, Collections, and Events based processes. With bulk delete, users can select multiple items, and delete them at once, as shown in the image below.
Default values for Dashboard Filters
When setting up dashboard filters, it is now possible to select default filter values, which are applied when viewing a Dashboard.
Dashboard filters provide an easy way to apply restrictions to multiple reports at the same time and get an overview of the state of the business. Until now there was no way to save the state of dashboard filters. Whenever you returned to a dashboard, you had to manually apply the filters again.
With this release, Optimize saves the state of filters when the dashboard is saved, and applies it whenever a user accesses the dashboard. This allows dashboard editors to create a default filter for the dashboard. Viewers can still remove filter values to see unfiltered reports, but with this new default filter functionality editors have more control over what their dashboard should display.
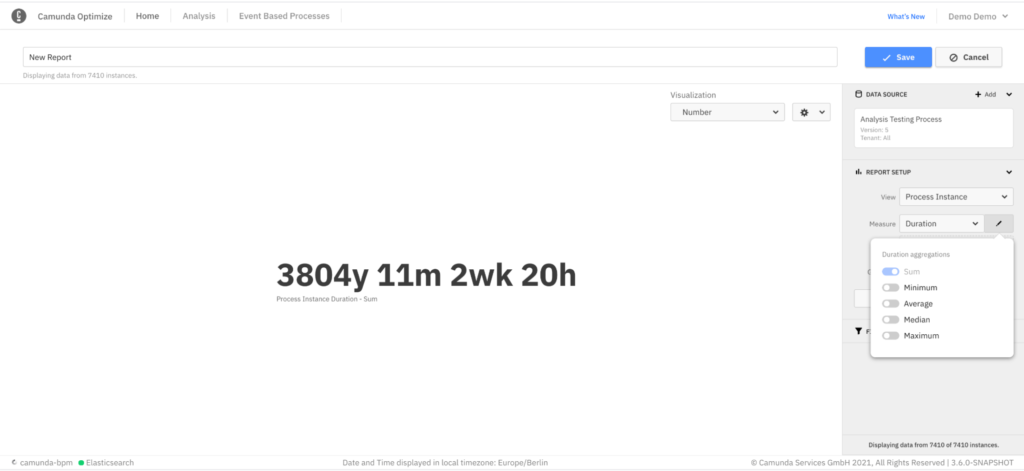
Sum aggregation for Duration Measure Reports
With this release, you can now see the total duration of all Process Instances or particular Flow Nodes and User tasks in Duration Measurement Reports. This aggregation is available for Process Instance, Flow Node as well as User Task Duration Reports.
Apply Identity Flow Node Filters to Flow Node Reports
Identity Filters (Assignee/Candidate Group), previously limited to User Task Reports, is now also applied to Flow Node Reports.
Previously, Assignee and Candidate Group Filters on Flow Node Reports always resulted in returning the full data of process instances – even when applied as Flow Node data Filters. With Optimize 3.5, we have implemented improvements to the Optimize Process Instance data structure, which allows all identity Filters to be applied on Flow Node Data level as well.
In practice, if you apply an “Assignee is user1” Filter to a Flow Node Report which includes an instance that has passed one Flow Node with the Assignee “user1” and one Flow Node with the Assignee “user2”, the result will differ depending on which Filter Level you have selected. Applying the Filter as an Instance Filter will remove the entire instance from the result, whereas applying it as Flow Node Filter will only remove the data associated with the second Flow Node from the result. This added flexibility makes it easier for you to refine the Report result, generating exactly the data insights you need.
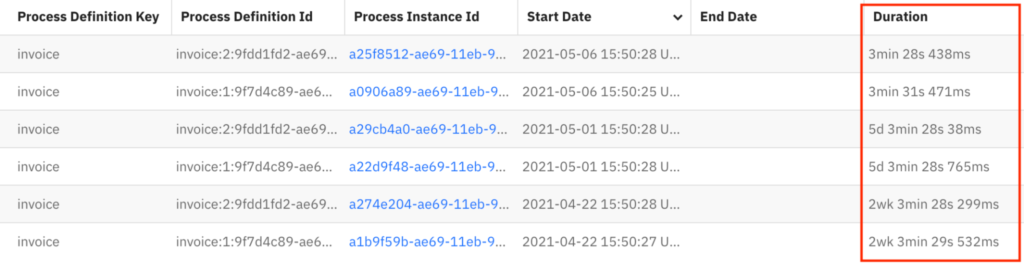
Duration of running Process Instances in Raw Data Reports
The duration of Process Instances is now displayed in the Raw Data Reports for Process Definitions.
So far in the Raw Data Reports for Process Definitions, it has only been possible to view the duration of completed process instances. With this release, we are making it possible to display the duration of running process instances as well.
Report Embedding Improvements
Optimize provides an easy way to embed your report in other websites. This can be achieved by using the sharing menu available on your report and dashboard view mode.
In this release, we added a more compact version of the report and dashboard share page that is used when embedding it in other applications. The new version has smaller layout spacing and a more compact header. This can be very useful in case you only have a small space available, and you would like to maximize the space used for showing the actual report or dashboard.
Additionally, it is now possible to hide the header completely from the share page, or specific parts of it, using an optional link parameter. You can find out more details on how to use the new parameter in our documentation.
Elasticsearch headers plugin
It is now possible to configure one or more plugins that add custom headers to requests made to Elasticsearch. One example where this might be useful is where you have secured your Elasticsearch instance with token-based authentication, where Optimize will allow your plugin to add the additional headers containing the token on a per-request basis.
You can find out more details on our plugins page.
How to get it
If you want to give Camunda Optimize a try, you can download the release here with your Enterprise customer credentials. Alternatively, you can sign up for a free 30-day trial version.
If you’re new to Optimize, we recommend that you watch the Getting Started with Optimize in less than 5 Minutes video.