
Camunda introduces c8ctl (pronounced “cocktail”), a minimal-dependency command line interface (CLI) for Camunda 8.8+. c8ctl covers your entire development lifecycle, from inspecting your cluster topology through deploying and debugging processes. And with MCP proxy, your AI copilot talks directly to your cluster via MCP.
With this post, we have provided a bit of a tutorial with examples of how to use and work with c8ctl. Grab a drink. Let’s walk through it together, and you can learn more about how this CLI can work for you.
Setting the scene
You’ve got a Camunda 8.8+ cluster running. Maybe it’s local via c8run, maybe it’s in our SaaS environment—either works. You’ve got BPMN files, DMN decisions, forms, and everything you need for your process. What you don’t have is the patience to click through a set of UIs just to determine if your cluster is alive or why your process might be stalled.
Enter `c8ctl` (alias `c8`). Built on the @camunda8/orchestration-cluster-api SDK, it keeps a single runtime dependency while exposing the full Camunda 8 REST API in your terminal. If you want to install the global binary, simply use npm install @camunda8/cli -g.
Note: Be sure to configure all the prerequisites so you can take advantage of this functionality.
With c8ctl, it’s like having a Camunda engineer built right into your terminal.
Act 1: “Is anybody home?” or inspecting your cluster
Every good development story starts with “does the thing even run?” Well, you can get that cluster status with a simple request to c8ctl:
c8 get topologyThat’s your cluster handshake. You’ll see brokers, partitions, replication factors, and the cluster version. Think of it as the heartbeat check before you start operating.
Already have multiple environments? c8ctl has profile management baked in and can even auto-import profiles from Camunda Desktop Modeler.
Here are some examples of using c8ctl with profiles.
- To see what profiles you have available, use
c8 list profiles. This will return something like this:
- To see your active profile, use
c8 which profile, which will return the profile name. - You can also switch to a new profile with
C8 use profile <PROFILE_NAME>. - Get a look at a specific topology without changing context with
c8 get topology --profile=prod.
Need a quick look at what’s deployed? What process instances are running? Anything stalled or stuck? Take a look at some of these helpful commands to investigate process information.
- Want to see what process definitions are available?
c8 list process-definitionsorc8 list pdwill return something like this: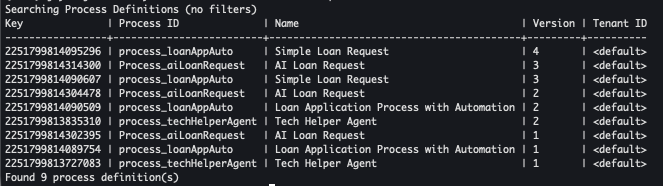
- What about active process instances?
c8 list process-instancesorc8 list piwill return something like this: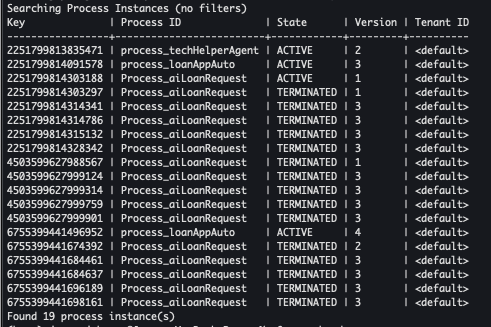
- And you can even see if trouble is brewing by obtaining a list of incidents using
c8 list inc --state=ACTIVE, which returns something like this if you have any active incidents:
Then, of course, you can use the search command. This allows the use of wildcard matching, case-insensitive filters, and the ability to slice across process instances, user tasks, incidents, jobs, and variables.
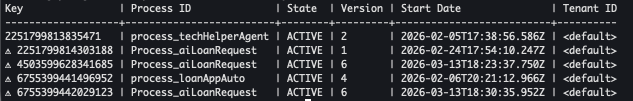
- Find all the process definitions with AI Loan in the name with
c8 search pd --iname="ai loan*"which in this case returned the following: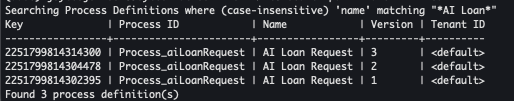
- Or to check for a specific error message (in this case error messages including Exception), use
c8 search inc --ierrorMessage='*Exception*', which provides this for output in our example environment:
- You can also find variables of a specific name with
c8 search variables --name=risk, and the risk variable values are shown in the results: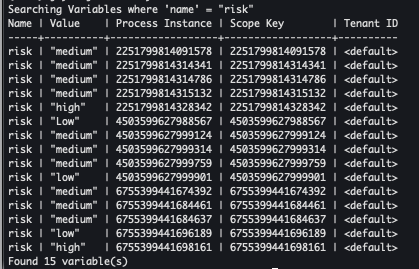
- Or even all variables in a specific process instance by instance key, with
c8 search variables --processInstanceKey=2251799813685249 --fullValue.
The results of this inspection:
- Cluster inspected
- Processes located
- Incidents surfaced
All from a single terminal. Let’s move on to the fun part.
Act 2: “Ship it” or deploying and managing processes
You’ve modeled your BPMN, crafted your DMN, and polished all your forms. Now it’s time to deploy that process or maybe an entire project. Well, now you can do that directly from the command line with c8ctl .
It is as simple as one of the following commands. The first is to deploy the order-process.bpmn process with c8 deploy "./New Loan Request.bpmn".
The results of a single BPMN deployment looks like the one shown below:

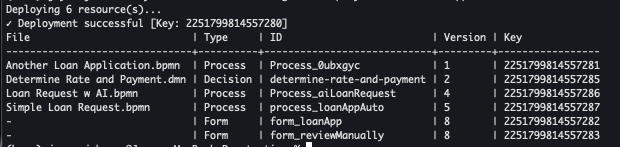
The second command will deploy an entire project: c8 deploy "Another Loan Application".
Here, Another Loan Application is a directory. The results of an entire process application might look something like this:
Keep in mind, c8ctl isn’t just blindly pushing bytes. It understands your project structure. Do you have any building blocks (you might know about these, but check them out in our documentation)? And what about the ability to not just deploy your process, but to run the instance too in a single command? Well, c8ctl will work for that as well.
Need to deploy and kick off an instance in one shot? The run command does exactly that:
c8 run './Loan Process w AI.bpmn' --variables'{"applicantID": 123456, "requestedLoan": 125000, "fullName": "Joyce Jones", "annualSalary": 455000, "applicantEmail": "joyce.johnson@camunda.com"}'In this case, the process is deployed and started and completed.
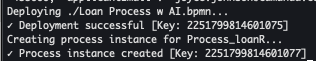
If we check this process in Camunda Operate, we will see the instance ID is started (and completed, in our case).

And managing the lifecycle is just as smooth. You can:
- Create a process instance using variables:
c8 create pi --id=Process_loanR --variables'{"applicantID": 123456, "requestedLoan": 125000, "fullName": "Joyce Jones", "annualSalary": 455000, "applicantEmail": "<a href="mailto:joyce.johnson@camunda.com">joyce.johnson@camunda.com</a>"}'
This returns the process instance ID that is created.
- Get details of the variables for the process instance with
c8 get pi 2251799814601077 --variables. This returns JSON for all the variables for this process instance. An example of a subset of the response is shown below:
- Cancel the process instance with
c8 cancel pi 2251799814610562. This returns confirmation of the canceled process instance:
In addition to the previous commands, you can also:
- Publish a message to a waiting catch event:
c8 publish msg payment-received --correlationKey=order-42 --variables='{"paid":true}' - Complete a user task with variables:
c8 complete ut 2251799813685250 --variables='{"approved":true}' - Resolve an incident (retry) after fixing the root cause:
c8 resolve inc 2251799813685251
Act 3: “The inner loop” or watch and wait mode
But that’s only part of the story. You can use c8ctl to help you build and iterate faster.
Watch mode: hot-reloading for process developers
If you’ve ever worked with a frontend framework, you know the joy of saving a file and seeing changes instantly available. With c8ctl, you can bring that same energy to your process development. You can watch a directory using c8 watch ./my-project (where my-project is the folder name). Any modifications to that directory are monitored for changes.
That’s it. Every time you save a .bpmn, .dmn, or .form file, c8ctl redeploys it automatically. No manual deploy step, no tab-switching, no losing your flow. Edit in your modeler, save, and the new version is live on your cluster without further intervention.
Await: “Don’t call me, I’ll call you”
After deployment, want to start an instance and wait for the result—all in one command? You can do this with C8 await pi --id=order-process --variables=’{‘orderId’:”42”}.
This creates a process instance and uses Camunda 8’s built-in server-side waiting to block until the process completes, returning the final variables. Perfect for testing short-lived processes or integration tests. Need a longer leash? Just add a --requestTimeout=60000 (where 60000 is in milliseconds) to your command.
Want to go a step further? Try combining both watch and await and you get a ridiculously tight feedback loop for something like this:
- Edit your BPMN in the modeler.
- Save (and watch as it auto-deploys).
- Run
awaitin another terminal (see the result).
Act 4: “Extend everything” or the plugin system
When Camunda created c8ctl it was deliberately lean. But you may want or need more and the plugin system lets you extend it without forking anything.
Plugins are regular npm packages with a c8ctl-plugin.js entry point. They get installed globally and appear right in c8 help.
- To provide a new plugin to c8ctl, simply enter
c8 init plugin my-awesome-tool. my-awesome-tool is the name you want to assign to your plugin. - Then you can load your plugin from either npm or from a Git URL. From npm:
c8 load plugin @camunda8/my-plugin-project
From a Git URL:c8 load plugin --from https://github.com/camunda/my-plugin-project - Check that it is in your help now, by using
c8 help.
So you want to check out how to do this with a real-world example? c8ctl-plugin-diagram-renderer is a community-built plugin that renders a BPMN diagram right in the CLI—who says terminals can’t be visual?
Install the rendering plugin via c8 load plugin --form https://github.com/camunda/c8ctl-plugin-diagram-renderer.
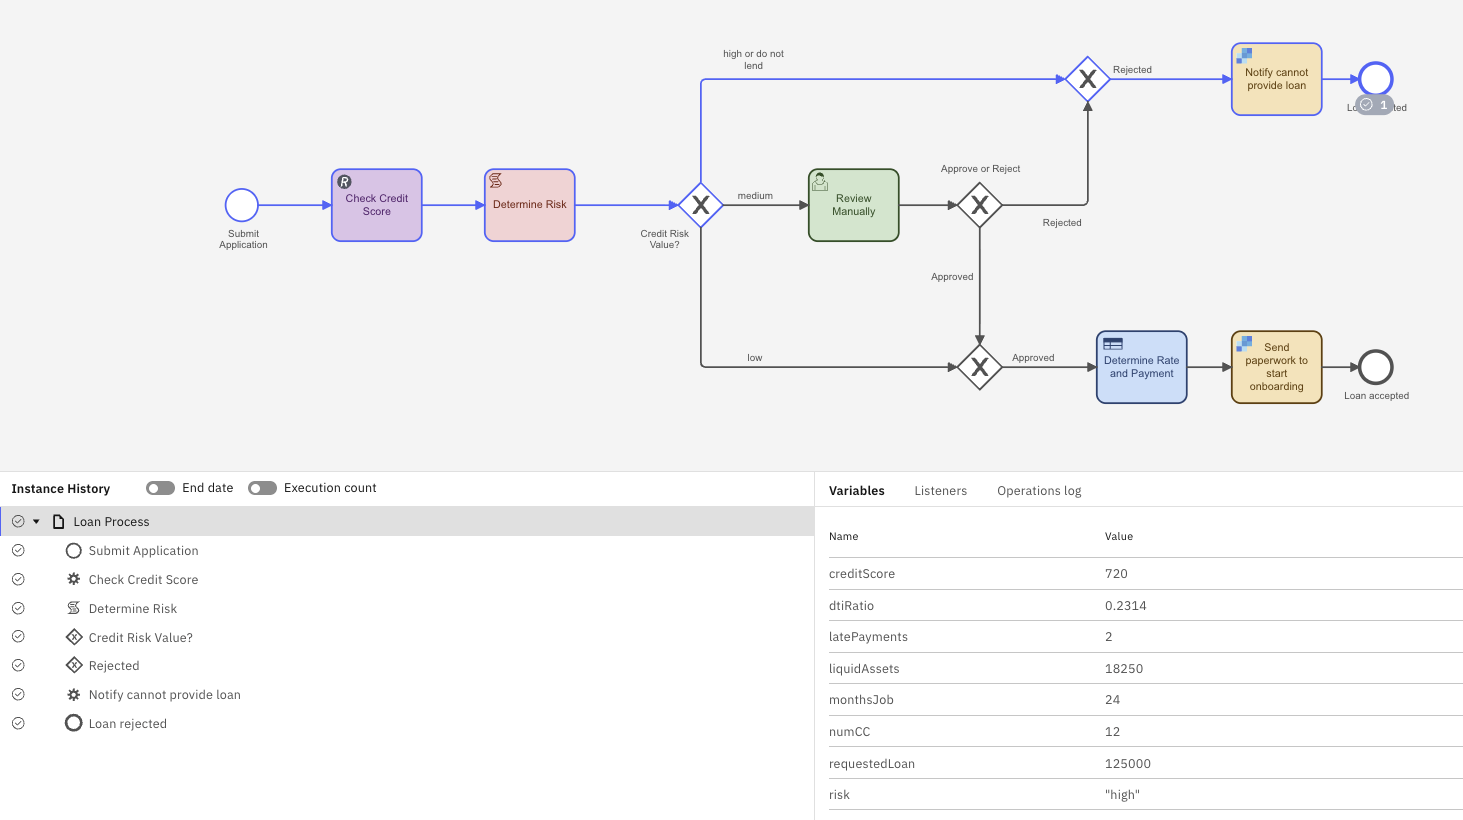
Once installed, you can execute something like `c8 diagram <PID> --output ./diagramA.png or even straight to the terminal (if yours support rendering graphics, such as iTerm2, Ghostty, or Kitty do) with c8 diagram <PID>.
This will create a PNG file of your diagram that will highlight where the process is at this time. The blue outline indicates complete/current steps. Here is an example output:

And don’t forget, plugins get full access to the c8ctl runtime: SDK client factory, tenant resolution, output-aware logging, essentially, the whole toolbox. This code should help you get started with your plugin, it shows how to import c8ctl‘s binary for use in the plugin:
import type { C8ctlPluginRuntime } from '@camunda8/cli/runtime';
const c8ctl = globalThis.c8ctl as C8ctlPluginRuntime;
const client = c8ctl.createClient();
const tenantId = c8ctl.resolveTenantId();
const logger = c8ctl.getLogger();
logger.info(`Operating on tenant: ${tenantId}`);
Manage the full lifecycle: load, upgrade, downgrade, unload, sync, list. Plugins respect your profile, tenant, and output mode settings. And they are available in your help descriptions using c8 help when they provide metadata. It’s extensibility done right.
Act 5: “Talk to your cluster via MCP” or the AI whisperer
Now, this is where things get really interesting.
c8ctl ships with an MCP (Model Context Protocol) proxy that bridges local AI tools—Claude Desktop, VS Code Copilot, or any MCP-compatible client to your Camunda 8 cluster:
C8 mcp-proxy
C8 mcp-proxy –profile=<PROFILE+NAME>
<PROFILE_NAME> is the name of the Camunda profile to bridge.
Note: You must have MCP enabled in your Camunda 8.9-alpha5 (or later) cluster.
What happens under the hood:
- Locally,
c8ctlruns an MCP server over STDIO. - Remotely, it connects to Camunda’s
/mcp/clusterendpoint (with Camunda 8.9+). - Authentication is handled automatically: token injection, 401 refresh, the works.
The result? Your AI coding assistant can directly query your Camunda cluster for doing actions like:
- Listing process instances
- Inspecting incidents
- Searching for stuck jobs
All through natural language, because the MCP bridge translates LLM tool calls into Camunda API requests.
This isn’t science fiction. Configure c8 mcp-proxy as a tool in your IDE’s AI setup, and your copilot literally becomes a Camunda operator.
Bonus act: Built for agents, not just humans
Here’s a detail that sets c8ctl apart: it was designed from the ground up to be consumed by AI agents, not just human developers. That means you get the type of responses back from c8ctl that a developer would want to see.
JSON output mode
Switch to JSON mode once, and every subsequent command emits machine-parseable output. Information and errors go to stderr, data goes to stdout.
So, assuming you are using text output and do a list of the process instances, you will see something like this:
Alternatively, if you switch to JSON output mode using c8 output json you will then see something like this:

Context window diet with –fields
LLMs operate within fixed token budgets. c8ctl respects those constraints by emitting only the required information and treating the context window as a scarce resource. That means you can limit your requests to only the information that you need, nothing more.
For example: C8 list pi --fields Key,State,processDefinitionID. Less noise, more signals.
Look before you leap with –dry-run
For AI agents making mutating calls, --dry-run outputs the exact API request that would be executed—without actually doing it. Use c8 create pi --id=order-process --dry-run, and you will see something like this:

The recommended AI agent workflow would be: dry-run → show user → confirm → execute. Safety by default.
Machine-readable help
In JSON mode, c8 help emits a fully structured command tree with all flags, types, aliases, and descriptions. An AI agent can bootstrap its understanding of the entire CLI in a single call.
The full SDLC, one CLI
Let’s zoom out and trace a typical Camunda development lifecycle through c8ctl:
| Phase | What You Do | c8ctl Commands |
| Setup | Connect to your cluster | c8 add profilec8 use profile |
| Verify | Check the cluster is alive | c8 get topologyc8 list pi |
| Develop | Edit BPMN/DMN/forms | c8 watch (auto-deploys on save) |
| Deploy | Push to cluster | c8 deployc8 run |
| Test | Run and verify | c8 await pi<br>c8 search pi<br>c8 get pi --variables |
| Debug | Find what’s broken | c8 search inc<br>c8 list jobs<br>c8 search variables |
| Operate | Fix and resolve | c8 get pd --xml<br>c8 resolve inc<br>c8 complete ut<br>c8 publish msg |
| Extend | Add custom capabilities | c8 load plugin<br>c8 init plugin |
| Automate | Let AI agents take the wheel | c8 mcp-proxy, --dry-run, --fields JSON mode |
From first connection to AI-assisted operations. One CLI. One dependency. All the things.
Getting started with a test drive
If you want to try a few more things yourself, simply execute these commands to get started. Of course, you will need a BPMN process before you get started.
- Install
c8ctl:npm install @camunda8/cli -g - See what’s out there by inspecting your cluster:
c8 get topology - Deploy your first process:
c8 deploy ./my-process.bpmn - Start watching:
c8 watch - Await a process instance in another terminal window:
c8 await pi –id=my-process
Built with a single dependency and open source, c8ctl is a cocktail of good CLI design, Camunda expertise, and agentic engineering.
Note: c8ctl is available on npm as @camunda8/cli. Source on GitHub.
Give it a spin. Your terminal will thank you.
Start the discussion at forum.camunda.io