How to use camunda-bpmn.js to visualize custom business data in process models

  • Blog
  • >
  • How to use camunda-bpmn.js to visualize custom business data in process models
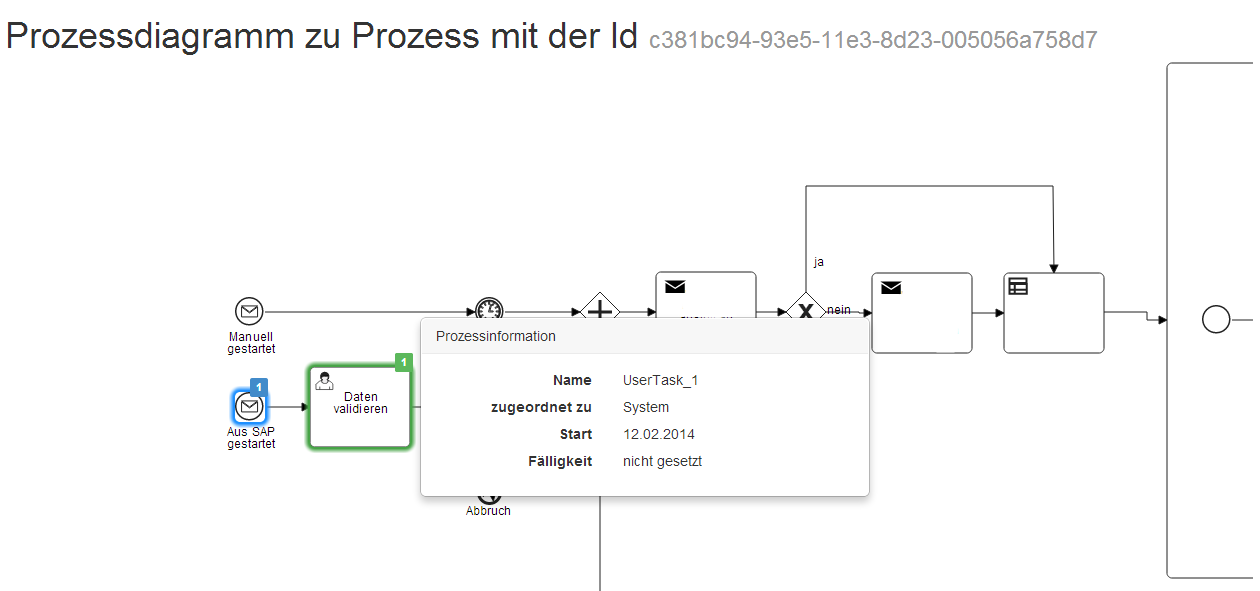
As part of camunda BPM we ship camunda-bpmn.js – a JavaScript framework to visualize BPMN 2.0 process models directly in your browser. It allows you to easily add own information to it. Daniel Klotz from our long-lasting customer Count+Care now leveraged that to show additional information on a process diagram to users (within their own application). He wrote a great tutorial and open sourced the code as an example on GitHub: https://github.com/zerounix/camunda.process.diagram.

process model

Great stuff – thanks a lot Daniel! And expect even more power with bpmn.io later this year 🙂 Happy coding…

Getting Started

Getting started on Camunda is easy thanks to our robust documentation and tutorials

Try All Features of Camunda

Related Content

Check out where many of Camunda's features and products begin: as an inspired experiment at Hackathon.
Enjoy more explicit configuration, fewer black box behaviors, and easier reviews and audits with Camunda 8.9's improved Helm secret management.
Why IT must embrace low code as part of a scalable automation strategy—not fight it.