
We’re excited to announce the release of Camunda Optimize 3.6.0-alpha2.
Camunda Optimize provides business activity monitoring for workflows, supporting continuous process improvement by providing transparency into your automated workflows and decisions. Business-friendly reports, dashboards and alerts make it possible to identify process bottlenecks and improve end-to-end processes.
If you’d like to get started with Optimize 3.6.0-alpha2 right away, you can download the release here with your Camunda Enterprise Platform customer credentials.
And if you’re not yet a Camunda customer, you can sign up here for a free 30-day trial of the Camunda Enterprise Platform, which includes Camunda Optimize.
In the rest of this post, we’ll highlight some of the new capabilities introduced in Optimize 3.6.0-alpha2.
Grouping by Process for Comparison
You can now easily compare the performance of multiple processes within the same overview report. The previous Optimize 3.5.0 release introduced reports that contained multiple processes. For example, you can get the count of started instances across multiple processes. With this new Optimize 3.6.0-alpha2 release, you can now see how the total number of started instances is distributed across the report’s different processes.
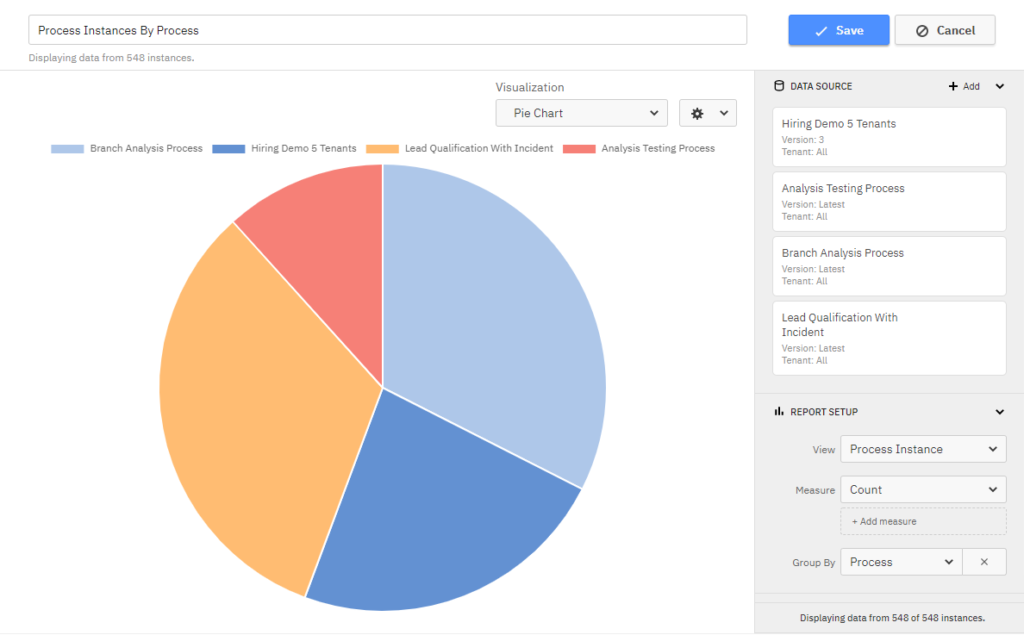
This feature is also available for process instance and flow-node reports. You can also combine this new grouping with other options (e.g., grouping both by start date and process) to answer complex questions like “How many instances of every process were started in each month of the last year?”
FlowNode Date Filters
In addition to filtering when a process instance started or ended, you can now filter when it went through a given step in your process through the new flow node date filter. Similar to process instance date filters, you have a variety of configuration options for both flow node start and end date filters: for a specific fixed date, a relative date(this year) or even a rolling (the last 7 days) date range.
This filter adds more fine-grained control over process instance and flow node levels. One sample use case is to assess duration based on the month that a specific user task began. Another use case is to evaluate only user tasks that a particular assignee began last week.
Combining these new flow node date filters with other available filters in the report builder will allow you even more flexibility to retrieve precisely the data that is most relevant to you.
You can now answer questions like “Can I see all the insurance claims that were approved last week?”
External Variable Ingestion
You can now augment your Optimize data with data stored in external databases through the external variable ingestion API. Augmenting data is particularly useful in scenarios where business data stored in an external system is relevant for process analysis in Optimize.
Previously, users with setups like these could use the variable plugin system to enrich their data upon import to Optimize. However, Optimize is not aware of changes to external systems, and those changes are not synchronized.
With the new variable ingestion API, users can directly feed external variables for specific instances to Optimize, deciding which external variable data Optimize ingests and when. Optimize then merges this data with the instance data provided by the engine, allowing report creation on external business data that would otherwise not be available.
Please note that this API is still a beta feature and will be subject to changes in the future.
New Chart Visualizations
If you have used Optimize in the past, you already know how helpful the bar and line chart visualizations are in recognizing patterns. Guess what?! We just made them even better.
You can now have both line and bar charts for count and duration data together in a single visualization. For example, you can display the process instance count as a bar chart and the duration as line charts as shown.
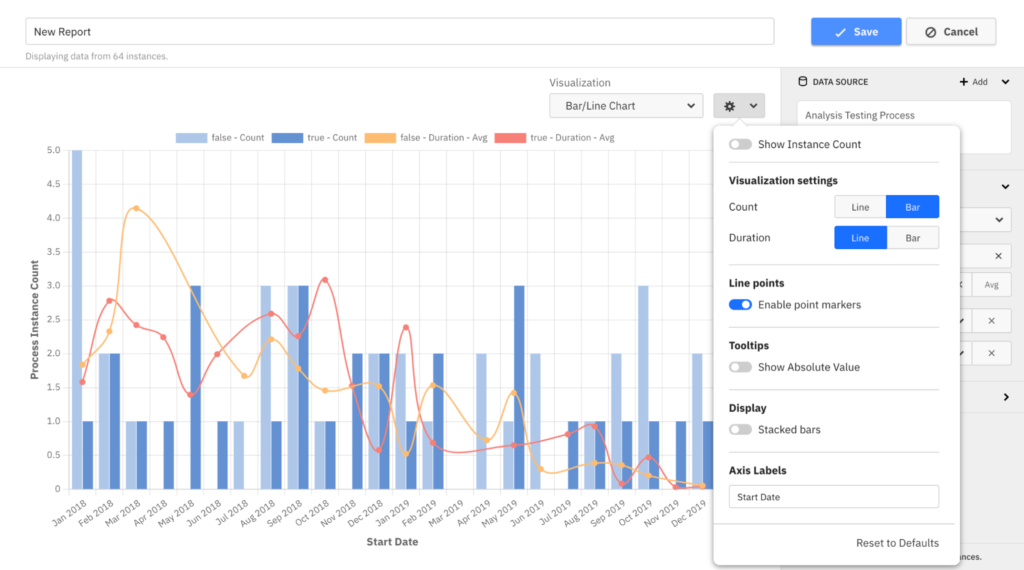
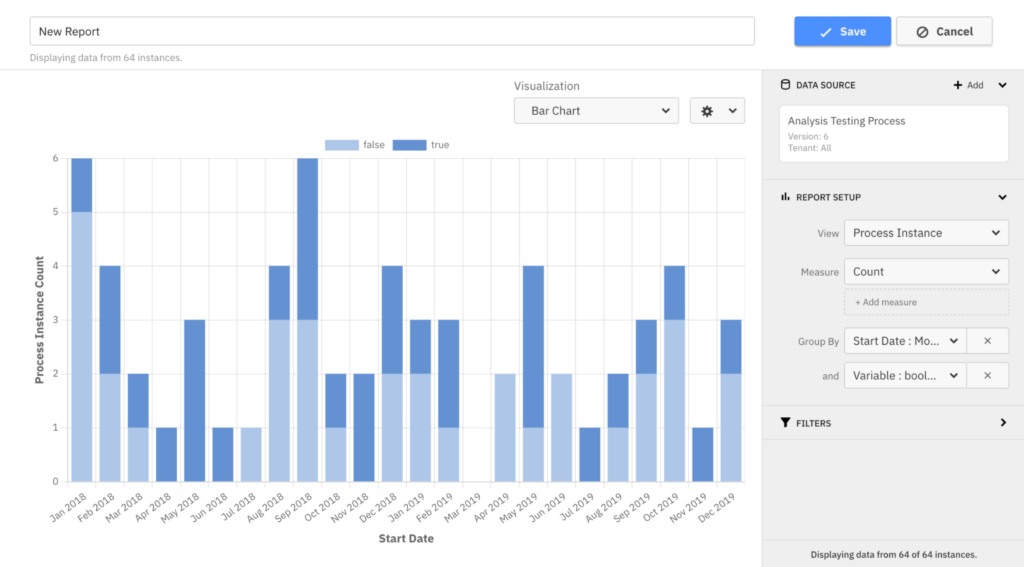
Another convenient addition to our charts is the ability to stack bar values on top of each other. As a result, users can now get a quick overview of the total values when you have more than one “group by” in your report. View this new option in the configuration popover.
What’s Next?
We’ll release the final version of Camunda Optimize 3.6.0 in October 2021. You can expect a smooth update from Camunda Optimize 3.5 to Optimize 3.6. Along with the minor release, we will publish a dedicated update guide. Stay tuned!
How to get it
If you want to try Camunda Optimize, you can download the release here with your enterprise customer credentials. If you’re not already a user, please sign up for a free 30-day trial version. We recommend all new Optimize users watch the Getting Started with Optimize in less than 5 Minutes video.