
We’re excited to announce the release of Camunda Optimize 3.6.0.
Camunda Optimize provides business activity monitoring for workflows, supporting continuous process improvement by providing transparency into your automated workflows and decisions. Business-friendly reports, dashboards, and alerts make it possible to identify process bottlenecks, improve end-to-end processes, and evaluate the success of your process automation initiative.
If you’d like to get started with Optimize 3.6.0 right away, you can download the release here with your Camunda Enterprise Platform customer credentials.
We’re also excited to announce that Optimize is now available as part of Camunda Cloud. Optimize 3.6.0 comes with dashboard and report creation, including variable data.
And if you’re not yet a Camunda customer, you can sign up here for a free 30-day trial of the Camunda Enterprise Platform, which includes Camunda Optimize.
In the rest of this post, we’ll highlight some of the new capabilities introduced in Optimize 3.6.0.
- TL/DR: What’s New?
- Eliminate Human-related Bottlenecks with a New Dashboard Template and Visualizations
- Process Improvement
- View the performance of a portfolio of up to 10 processes
- Conclusion
- What’s Next?
- How to Get It
TL/DR: What’s New?
This release has new functionality for first-time users, power users and leadership.
- First-time users get a jumpstart through pre-configured dashboards that walk them through how to use Optimize effectively
- Power users get even more flexibility in filtering and augmenting data
- Leadership gets the ability to evaluate the holistic performance of several processes
Check it out!
Eliminate Human-related Bottlenecks with a New Dashboard Template and Visualizations
If you have a process including human tasks, you probably have a bottleneck. Optimize 3.6.0 introduces a pre-configured dashboard template that specializes in eliminating human-related bottlenecks. It guides you through this process by providing data visualizations that answer these questions:
- Where is your bottleneck?
- How bad is your bottleneck?
- How does the task assignee affect the bottleneck?
- Are your tasks becoming more efficient?
- Is work delivered smoothly to the bottleneck?
- How many tasks are waiting at the bottleneck?
- Is the bottleneck improving?
- How productive are your workers?
- How long does each user task take?
Here’s an example below, based on our popular hiring demo. Next, I’ll walk you through the insights you can gain from this dashboard, report by report.
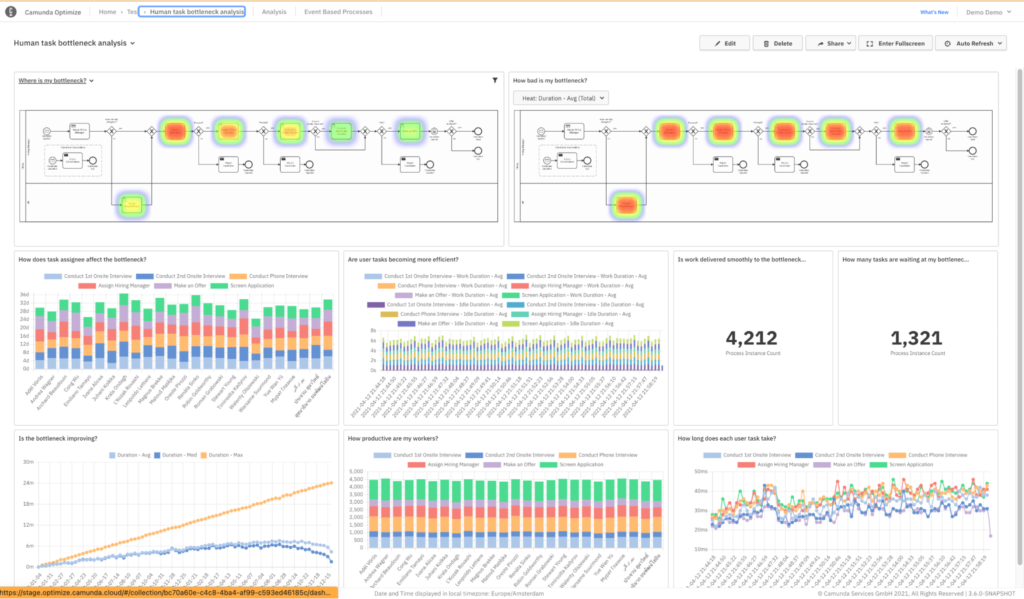
- The bottleneck happens during application screening.
- However, an average task in this process takes a long time, one to two weeks.
- There’s a two to three times variation in how long work takes for an individual task, suggesting standardization could improve overall performance.
- Efficiency doesn’t appear to improve over time. In addition, candidates spend a massive amount of time waiting for interviews compared to their interviewing time.
- There’s a massive backlog of tasks before the bottleneck. When that hits the backlog, it’s likely to cause even longer wait times.
- There’s a long queue of work at the bottleneck. It might be time to increase capacity there.
- Although average and median times are finally dropping, max duration continues to climb. Work is piling up and not being completed.
- Workers have completed an average of 4500 tasks. We could further benefit from a dashboard filter.
- User task duration seems to be slowly climbing but still low.
What’s the major takeaway? This process needs improvement. The entire process takes months to complete, work is unstandardized, and it’s likely frustrating users. If we can reduce how much time a worker spends per applicant, we can start reducing the long waits and get this process back under control.
Want an even deeper dive into how to perform this analysis? Check out our recent Bottleneck blog post.
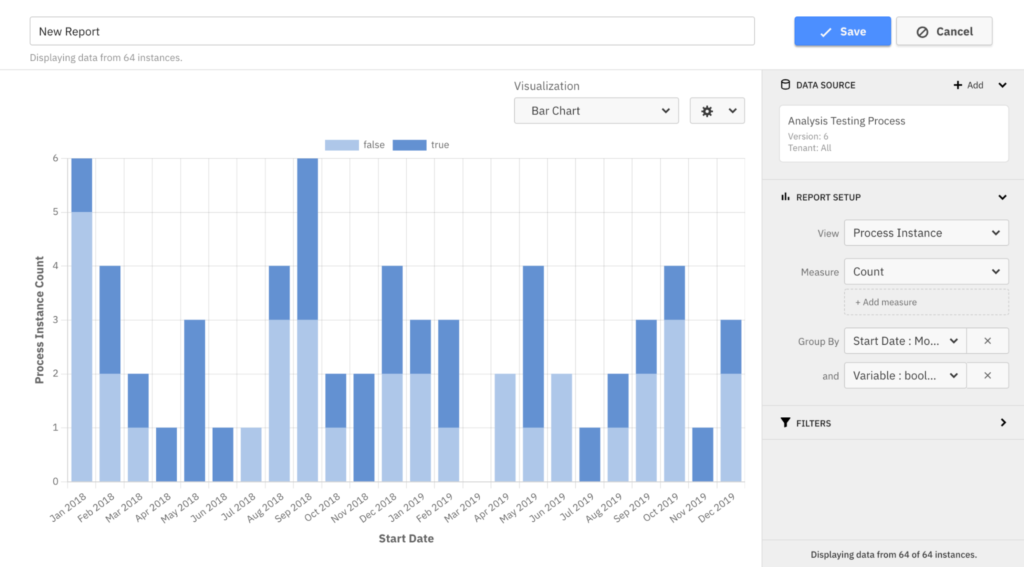
You might have noticed stacked bar charts – this is a new feature that helps clean up visualizations and drill down into your data more quickly.
New chart visualizations
If you have used Optimize in the past, you already know how helpful the bar and line chart visualizations are in recognizing patterns. Guess what?! We just made them even better.
You can now have both line and bar charts for count and duration data together in a single visualization. For example, you can display the process instance count as a bar chart and the duration as line charts as shown.
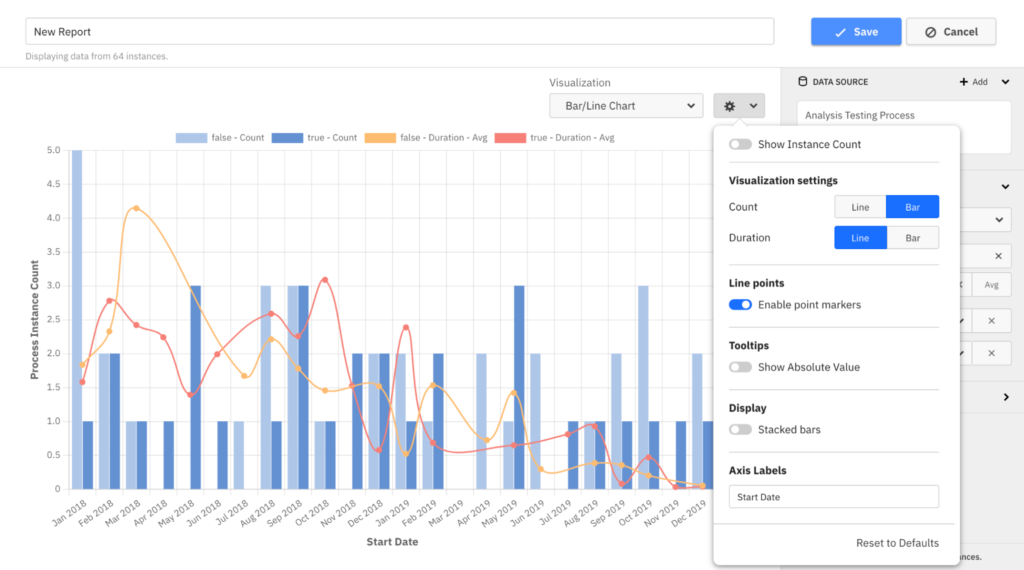
Another convenient addition to our charts is the ability to stack bar values on top of each other. As a result, users can now get a quick overview of the total values when you have more than one group by in your report. View this new option in the configuration popover.
Process Improvement
In addition to bottleneck detection, there are some improvements to overall process improvement. Optimize 3.6.0 comes with an upgraded process performance dashboard template, the ability to combine variable data from multiple sources, and date-related filters on a single node. Existing users can now analyze and improve their process’s performance in greater detail.
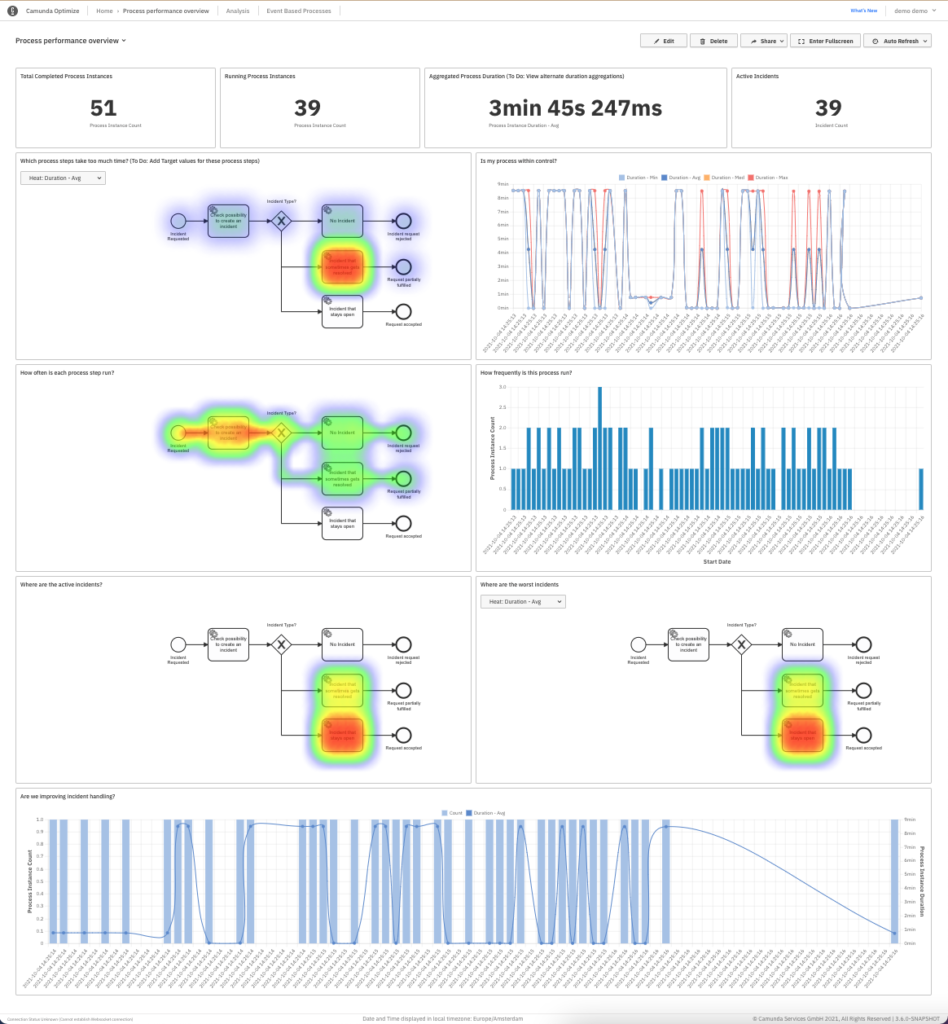
Upgraded process performance dashboard template
First, we’ve upgraded the Process performance dashboard template. It now leverages the Incident Report feature introduced as part of Optimize 3.2.0 to show you how many incidents are open, where they tend to occur, how long they take and how resolution time changes over time. These reports are currently only available on the Camunda Platform, and we will build them into Camunda Cloud in the future.
External variable ingestion
Camunda Optimize isn’t trying to be your database of record for all data related to your processes. However, you can now augment your Optimize data with data stored in external databases through the external variable ingestion API. Augmenting data is particularly useful in scenarios where business data stored in an external system is relevant for process analysis in Optimize.
Previously, users with setups like these could use the variable plugin system to enrich their data upon import to Optimize. However, Optimize is not aware of changes to external systems and those changes are not synchronized.
With the new variable ingestion API, users can directly feed external variables for specific instances to Optimize, deciding which external variable data Optimize ingests and when. Optimize then merges this data with the instance data provided by the engine, allowing report creation on external business data that would otherwise not be available.
Please note that this API is still a beta feature and will be subject to changes in the future.
Flow-node date filters
In addition to filtering when a process instance started or ended, you can now filter when it went through a given step in your process through the new flow-node date filter. Like process instance date filters, you have various configuration options for both flow-node start and end date filters: for a specific fixed date, after a certain date (e.g., this year), or even a rolling date range (e.g., last week).
This filter adds more fine-grained control over which data you can examine for trends. For example, one use case is assessing duration based on the month that a specific user task began. Another use case is to evaluate only user tasks that a particular assignee began last week.
Combining these new flow-node date filters with other available filters in the report builder will allow you even more flexibility to retrieve precisely the data that is most relevant to you.
You can now answer questions like “Can I see all the insurance claims that were approved last week?”
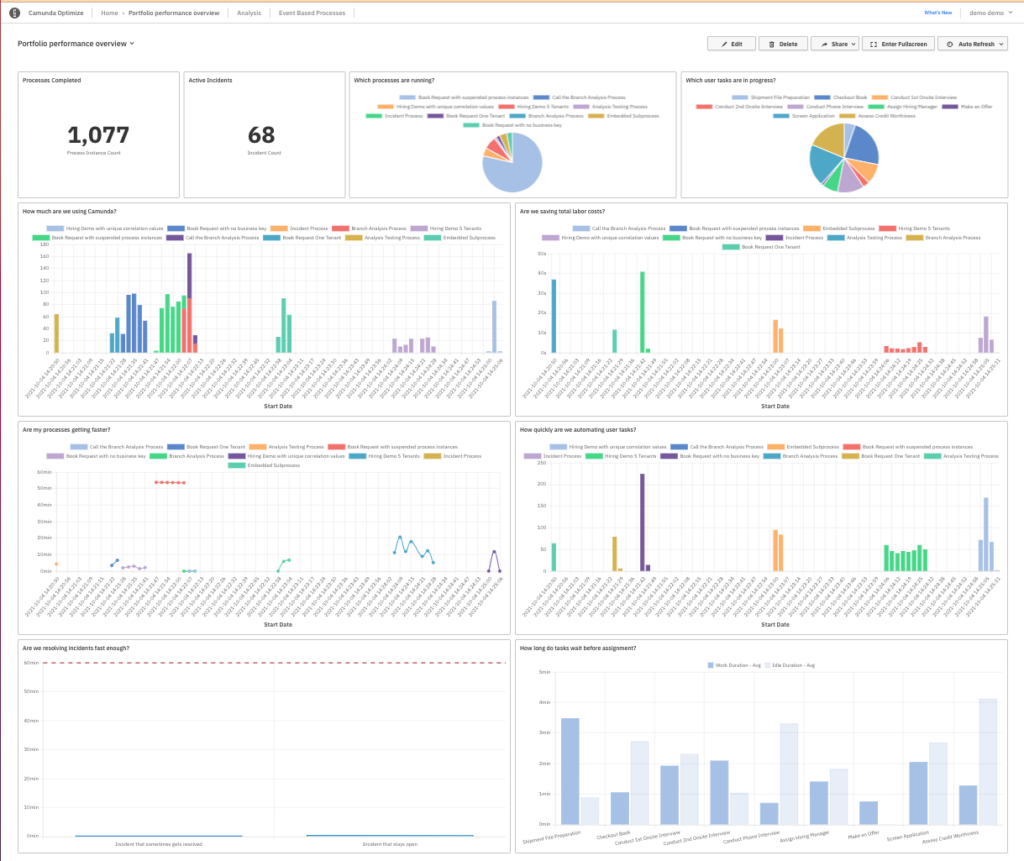
View the Performance of a Portfolio of Up to 10 Processes
Camunda Optimize is beginning alpha support for a new capability – managing your portfolio of processes automated with Camunda.
This capability builds on the ability to create multi-process reports in Optimize 3.5.0.
Optimize now has a pre-configured dashboard template that specializes in giving you an overview of up to 10 different processes. With a few minutes of additional configuration, you have data visualizations that show you:
- How many process instances have been completed?
- How many process instances are running?
- How many active incidents do you have?
- Which user tasks are currently in process?
- How much are you using Camunda over time?
- Are you saving total labor costs?
- Are your processes getting faster?
- Are you automating user tasks?
- Are you resolving incidents fast enough?
- How long do tasks wait before being assigned?
Here’s an example of a portfolio performance overview that makes heavy use of pie charts and stacked bar charts to compare different processes. However, this dummy data undersells the value of this feature. With your production data, you’ll be able to see a single dashboard that shows your Camunda usage increase, labor costs decrease, processes get faster and customers get happier.
Why share this dashboard now? There’s one critical feature that enables it.
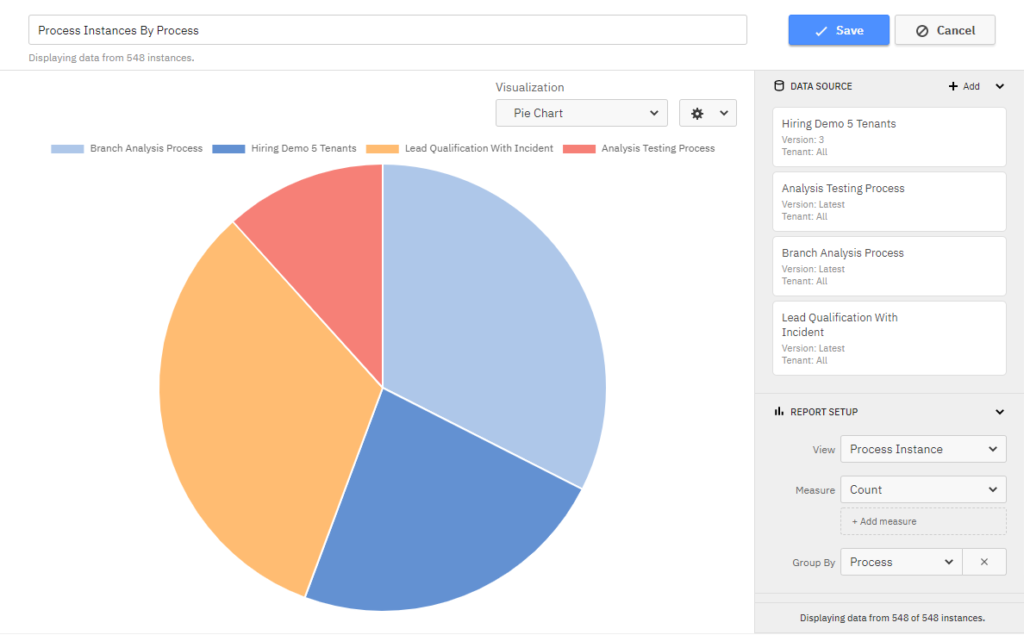
Grouping by process for comparison
You can now easily compare the performance of multiple processes within the same overview report. The previous Optimize 3.5.0 release introduced reports that contained multiple processes. For example, you can get the count of started instances across multiple processes. With this new Optimize 3.6.0 release, you can now see how the total number of started instances is distributed across the report’s different processes.
This feature is also available for process instance and flow-node reports. You can also combine this new grouping with other options (e.g., grouping both by start date and process) to answer even more complex questions. One example is “How how many times did we run each process in each month of the previous year?”
You can now collect more data into a single view, but sometimes you can pull in too much data to create a clear report.
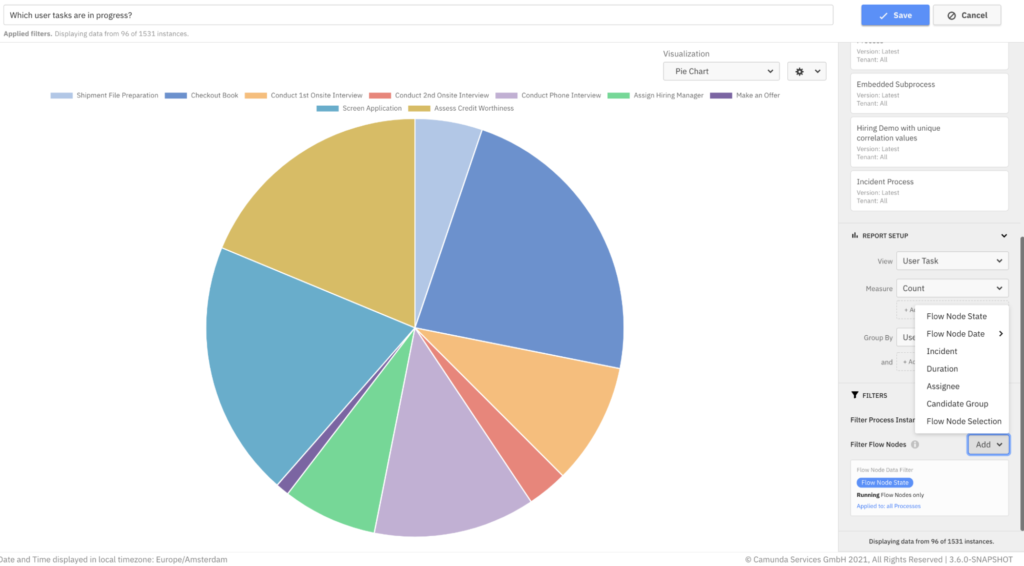
Flow-node filters for multi-process reports
Optimize’s new flow-node filters on multi-process reports let you use data about what happened in the middle of your processes to tell the right story. One example shows up in the portfolio overview dashboard; it filters all process instances that don’t have an active user task.
You can also do much more with:
- Filter by flow-node date to see which user tasks which were completed last week
- Filter by flow-node duration to see which user tasks break your 24-hour SLA
- Filter by candidate group to see how many user tasks are waiting on the support team
Once you’ve performed coarse process improvement on process instance data, dig deep into flow-node data to continue finding ways to optimize your processes further.
Conclusion
Optimize 3.6.0 reduces the time it takes to get started with Optimize, enables even more detailed data analysis and collects all the information your leadership needs to justify that next project.
So what are you waiting for?!
Upgrade to Optimize 3.6.0!
What’s Next?
We’ll release the next alpha of Camunda Optimize 3.7.0 in November 2021. Stay tuned!
It’ll be a smooth update from Camunda Optimize 3.5.0 to Optimize 3.6.0. Along with the minor release, we will publish a dedicated update guide.
How to Get It
If you want to give Camunda Optimize a try, you can download the release here with your enterprise customer credentials. Please sign up for a free 30-day trial version.
If you’re new to Optimize, we recommend that you watch the Getting Started with Optimize in less than 5 Minutes video.