We’re excited to announce the release of Camunda Optimize 3.8.0. Camunda Optimize provides business activity monitoring for workflows, supporting continuous process improvement by providing transparency into your automated workflows and decisions. Business-friendly reports, dashboards, and alerts make it possible to identify process bottlenecks, improve end-to-end processes, and evaluate the success of your process automation initiative.
If you’d like to start Optimize 3.8 right away, you can download the release with your Camunda Platform customer credentials.
If you’re not yet a Camunda user, you can sign up for a free 30-day trial of Camunda Platform 8, including Camunda Optimize.
What’s New?
Not all process automation investments lead to business success. You’ll always need buy-in from your stakeholders, even if you know it’s necessary to improve a process. When you have 10 different processes to choose from, it gets even more challenging to identify the most critical thing to improve. Optimize 3.8 focuses on solving this problem.
This new release introduces the ability to set and track time-based business goals and features designed to make it easier to identify the most critical problems to solve.
Set and track time-based goals
- Process page: View the goal status of all your processes on a single page.
- Process owner: Assign the responsibility for process health to have the right conversation with the right person to fix a process.
- Time-based goals: Set and track data-driven guarantees on how long a process should take.
KPI reports
- Percentage reports: Create reports and alerts tracking percentages like fully-automated instances or incident-free rate (%), and the raw count.
- Duration percentile reports: Create reports tracking standard service level agreement (SLA) statistics like P99 or P95 duration, and the minimum, median, and maximum.
UX improvements
- Sample data: Start optimizing with a pre-loaded process and realistic data from day one.
- Legible variable names: Rename a variable like someVar_123, so your business stakeholders can understand your dashboards.
- Cleaner outlier analysis: In outlier analysis, we filter out irrelevant flow nodes, like gateways to focus on outliers that matter.
- Rolling date dashboard filters: Apply a dashboard-level filter showing process performance over the last week, 30 days, or 90 days, to understand KPI changes over time.
- Closed incidents: Analyze deleted incidents to understand if your DevOps team handles incidents as expected.
- Dashboard and report type on import: Easily debug API-based dashboard and report import operations.
- Native JSON variable support: Optimize unpacks JSON variables just like object variables, so you can analyze more data and gain more insights.
New to Camunda Platform 8
- API access (New to Camunda Platform 8 SaaS): Use secure REST APIs to append business data, download report results, and more.
- Sharing (New to Camunda Platform 8): Share or embed dashboards and reports so that everyone can make data-driven decisions.
Set and track time-based goals
You can now set data-driven SLAs on how long every process should take to identify which ones are underperforming.
There’s a lot of new functionality here, so we’ll walk you through what’s happening in the GIF below:

The Processes page and process ownership
We’re pivoting to make your business processes the center of your Optimize user experience instead of the current collection-based folder structure. The first step is to show you all the processes you’re trying to optimize. The first thing you can do is set a process owner. You can sort by process owner to see how each of your process owners perform. Assigning ownership is simply giving accountability for a process’ success for now, but it lays the foundation for exciting features like easier alert creation in future releases.
Time-based goal setting
The new time-based goals are a reimagined way of leveraging the same Optimize functionality to create meaningful conversations. Once you open up the modal, you’ll be met by two goals: a target goal and an SLA goal for process instance duration. The target goal assumes that 75% of your process instances follow your happy path or can automatically be resolved entirely. In contrast, the SLA goal is to ensure that you can still guarantee your customers how long a process should take while excluding outliers, even if human intervention is required.
Optimize automatically suggests goals and shows you the distribution, so the business and IT can quickly agree on how long a process should take to complete.
Once you set the goals, you can see their status saved to the Processes page. First, sort by goal status to identify the processes that need the most attention, then hover over the goal status to gain a quick insight into their performance.
Now that Optimize knows what you’re trying to accomplish, we can start building features that give you personalized visualizations or highlight potential issues in your process.
KPI reports
Meaningful reporting
There’s a good chance you have sophisticated metrics that are useless for actual decision making. And it’s not your fault. Data can be really misleading.
Here’s an example of why averages are horrible for making decisions. Five people go out for dinner. Their average age is 21. Where should they go? If you answered “a bar,” you might be missing some critical information.
One of them is an 81-year-old woman, and the rest are six-year-old children. The minimum, median, and 75 percentile ages are all six, and the 95 and 99 percentile are 81. These percentiles give you a much better idea about the age distribution.
2) Counts << Percentages
Here’s another example of why raw counts aren’t very helpful.
There are 50 active incidents, 86 process instances have been fully automated, and 23 process instances have exceeded their SLA. Is this good or bad? If you have 100 process instances, you need to contact your engineering lead, and ask them to reduce the incident rate and fix incidents faster. If you have 1000 process instances, you need to figure out how to automate more user tasks.
However, an incident-free rate of 95%, an automation rate of 8.6%, and an SLA failure rate of 2.3% are unambiguous. Even better, you can compare those values across multiple processes.
Percentage report
We’re introducing the ability to create reports and alerts tracking percentages like fully-automated instances or incident rate (%).
With percentage reports, you can answer questions like:
- What percentage of my process instances were fully automated?
- What percentage of my process instances don’t have incidents?
- What percentage of my process instances were sent back due to an error?
- What percentage of my process instances went through a manual review process?
- What percentage of my process instances were completed “successfully?”
- What percentage of my process instances took longer than one week to complete?
Duration percentile reports
In addition, you can create reports and alerts tracking SLA statistics on P99 or P95 durations along with the minimum, median, and maximum.
- How long does it take to complete 75% of the process instances?
- What duration should I use for a service level agreement, assuming 1% exceeds that value?
Putting it Together

Create alerts on these reports to immediately determine when your process is underperforming.
Then, when the alert fires, you can use Optimize’s other filters to drill down to find high-ROI solutions. Here are a few ideas:
- View a filtered heatmap to see where your underperforming process instances spend the most time.
- View an incident duration report to see how impactful these incidents are on the overall process duration.
- View process duration reports filtered by flow-node to compare the average duration of successful and unsuccessful process instances.
- (Camunda Platform 8 Only) Visit Operate to see the most common incident error messages.
Improved UX
We’ve made many minor UX improvements with the last release. You can now rename variables in plain language, filter out noisy outlier analysis heatmaps, and apply rolling date filters to your dashboards to focus on the most critical data.
Sample data
Still in development? No problem! We’ve embedded a sample dataset for analysis with every Optimize 3.8+ download.
The Customer Onboardingprocess is one of our all-time favorites. Here’s how it works.
A customer applies for a new contract and provides documentation. Then, a decision table generates a high, medium, or low risk for the customer. Low-risk applications are automatically approved, high-risk applications are automatically rejected, and medium-risk applications are sent to an employee. Next, that employee reviews the medium-risk application and sends it back if additional documentation is needed. Finally, team leaders are notified if the employee takes too long to review the application.
Here’s a walkthrough of the process below:
Share a dashboard based on this process with one of your business stakeholders, so they can see what Optimize can do without a demo or production data.
Legible variable names
You don’t have to settle for the unreadable variable names set up by your developers in Modeler. Instead, you can use the Optimize UI to override your variable names.
See the Camunda Optimize 3.8.0 alpha-1 blog post for more details.
Cleaner outlier analysis
We’ve cleaned up the outlier analysis graph, so you can focus on improving process steps that you have control over. See the Camunda Optimize 3.8.0 alpha-1 blog post for more details.
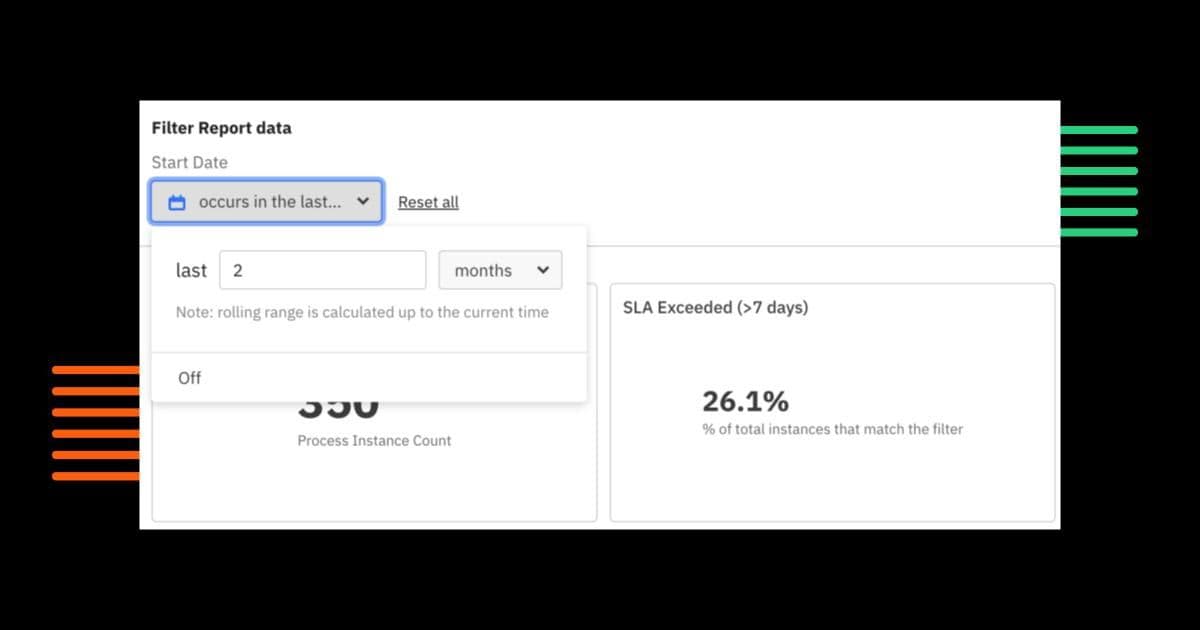
Rolling date dashboard filters
Apply a dashboard-level filter showing process performance over the last week, month, or three months to understand KPI changes over time. Here’s an example of tracking the percentage of applications in the last two months where the seven-day promise was broken.

Closed incidents
Closed or deleted incidents are no longer hidden from Optimize’s reports. See how many incidents were cleaned up from a development environment or deleted without resolution.

Dashboard and report type on import
If you use our public API to import dashboards or reports, we now include the entityType of each ID on the response. If there are any issues on import, you can better understand what happened and learn how to fix it.
Native JSON variable support
If you use Native JSON variables, you might be delighted to find out that we process them similarly to object variables. Read more about object variable processing in the Camunda Optimize 3.7 blog post.
New to Camunda Platform 8
API access (New to Camunda Platform 8 SaaS)
Use secure REST APIs to append business data, download report results, and more.
Not running Camunda Platform 8 SaaS? You’re also in luck. While implementing this feature, we also implemented a robust Spring Security-based authentication method for Camunda Platform 7 and Camunda Platform 8 Self-Managed users. There’s also backward compatibility for the previous authentication method so that you can secure your APIs at your leisure.
See the Camunda Optimize 3.8.0 alpha-2 blog post for more details.
Sharing (New to Camunda Platform 8)
While dashboard and report sharing have already been released for Camunda Platform 7, we’re introducing it to our cloud-based products.
- Share a dashboard with stakeholders to track process KPIs without time-consuming report creation or meetings.
- Embed a dashboard into your application or analytics tool to keep your business intelligence architecture simple.
- Pre-filter your dashboard, so your stakeholders only see relevant data.
See the Camunda docs for more details.
What’s Next?
Alongside the Camunda Platform 8 release, we’ve changed our release cadence.
Camunda Optimize minor versions will be released every six months, rather than three months.
However, we intend to promote alpha releases to preview releases with supported update paths. This will allow you to use newer features even earlier than before. Stay tuned for our upcoming release notes!
We’ll release the next iteration of Camunda Optimize in May 2022. As mentioned, you’ll be able to use this version safely in production.
If you prefer to wait, we’ll release the full version of Camunda Optimize 3.9 in October 2022. Stay tuned.
It should be a smooth update from Camunda Optimize 3.7 to Camunda Optimize 3.8. Along with the minor release, we’ll publish a dedicated update guide.
How to Get It
If you want to give Camunda Optimize a try, you can download the release with your Camunda Platform 8 Enterprise credentials. Not a user yet? Sign up for a free 30-day trial of Camunda Platform 8. If you’re new to Optimize, we recommend that you watch the Getting Started with Optimize in less than 5 Minutes video.


