We are happy to announce the release of Camunda Optimize version 2.2.0-alpha2. This release was mainly focused on improving the UI/UX of the application. The design of the Reports/Dashboards/Alerts lists were improved. A Loading indicator is added throughout the application that appears every time the data is being loaded from the server. Another interesting feature, is the night time mode in the dashboard view. There are also some performance improvements such as the caching of bpmn diagrams.
This release marks the second alpha release of Camunda Optimize 2.2.0.
The complete release notes are available in Jira.
You can try out a free trial of Camunda Optimize.
Improve the UI/UX of the Reports/Dashboards/Alerts list
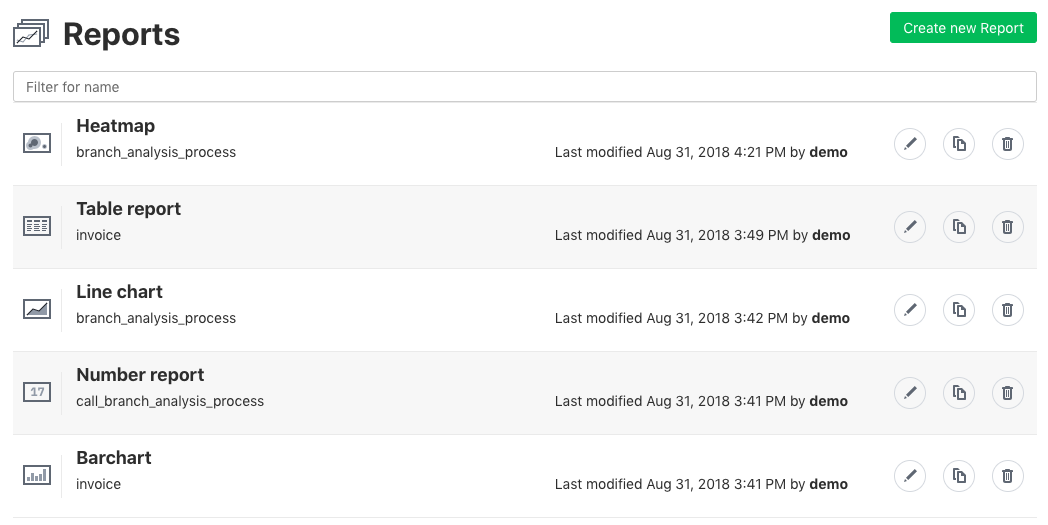
Before this release, the reports, dashboards and alerts lists were inconsistent in term of styling and the information provided. In this release we tried to improve that by adding extra information and icons to the lists. For example, A report list item now includes the selected process definition name. Moreover, Icons are also added according to the report type whether it is a number, table, bar chart, pie chart or heatmap.

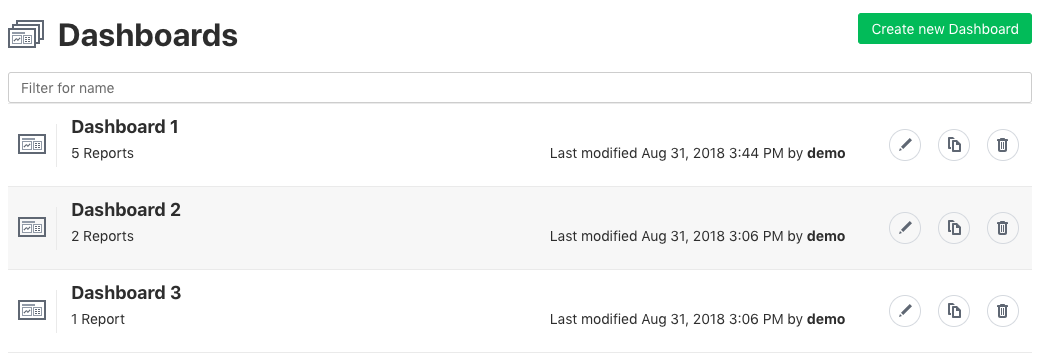
The dashboard list items also got updated. A dashboard list item now indicates how many reports are available inside as shown in the image below:

The Alert list before this release was not consistent with the other list. Therefore, we unified its styling with the other lists

Added night-time mode in Dashboard full screen mode
One of the key features that Optimize provides is the monitoring of the data. You create a dashboard with reports depicting all the important information at one glance. Therefore many users had a large screen in their office running Optimize with a dashboard on it. As soon as there occurred profound changes in their workflow they could immediately spot that on the dashboard.
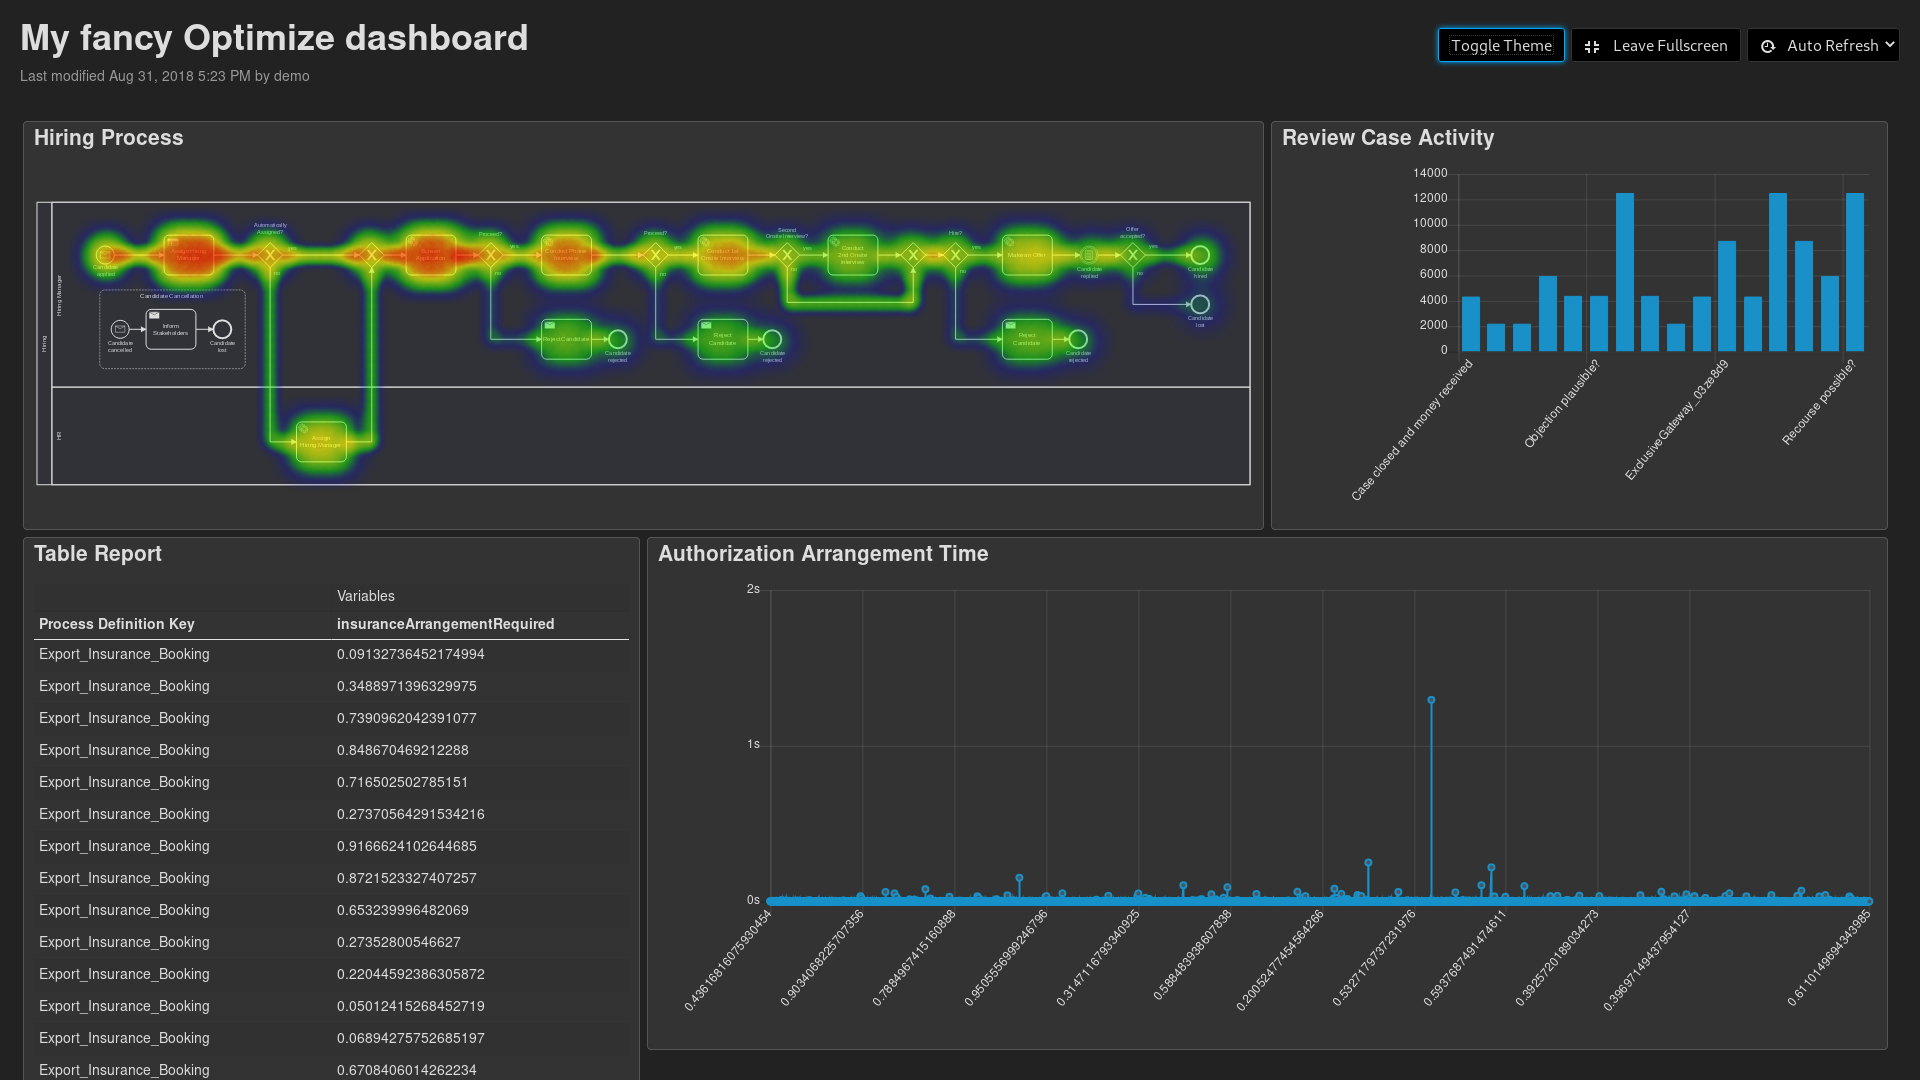
However, during the night a bright screen can be really painful to look at after a while. To mitigate this problem, the new release of Optimize allows to toggle the theme in the fullscreen dashboard mode, such that everything becomes dark. That makes watching the Optimize dashboard even during the night time a pleasant experience. In the following you can see an example dark mode version of the dashboard:

Loading indicator
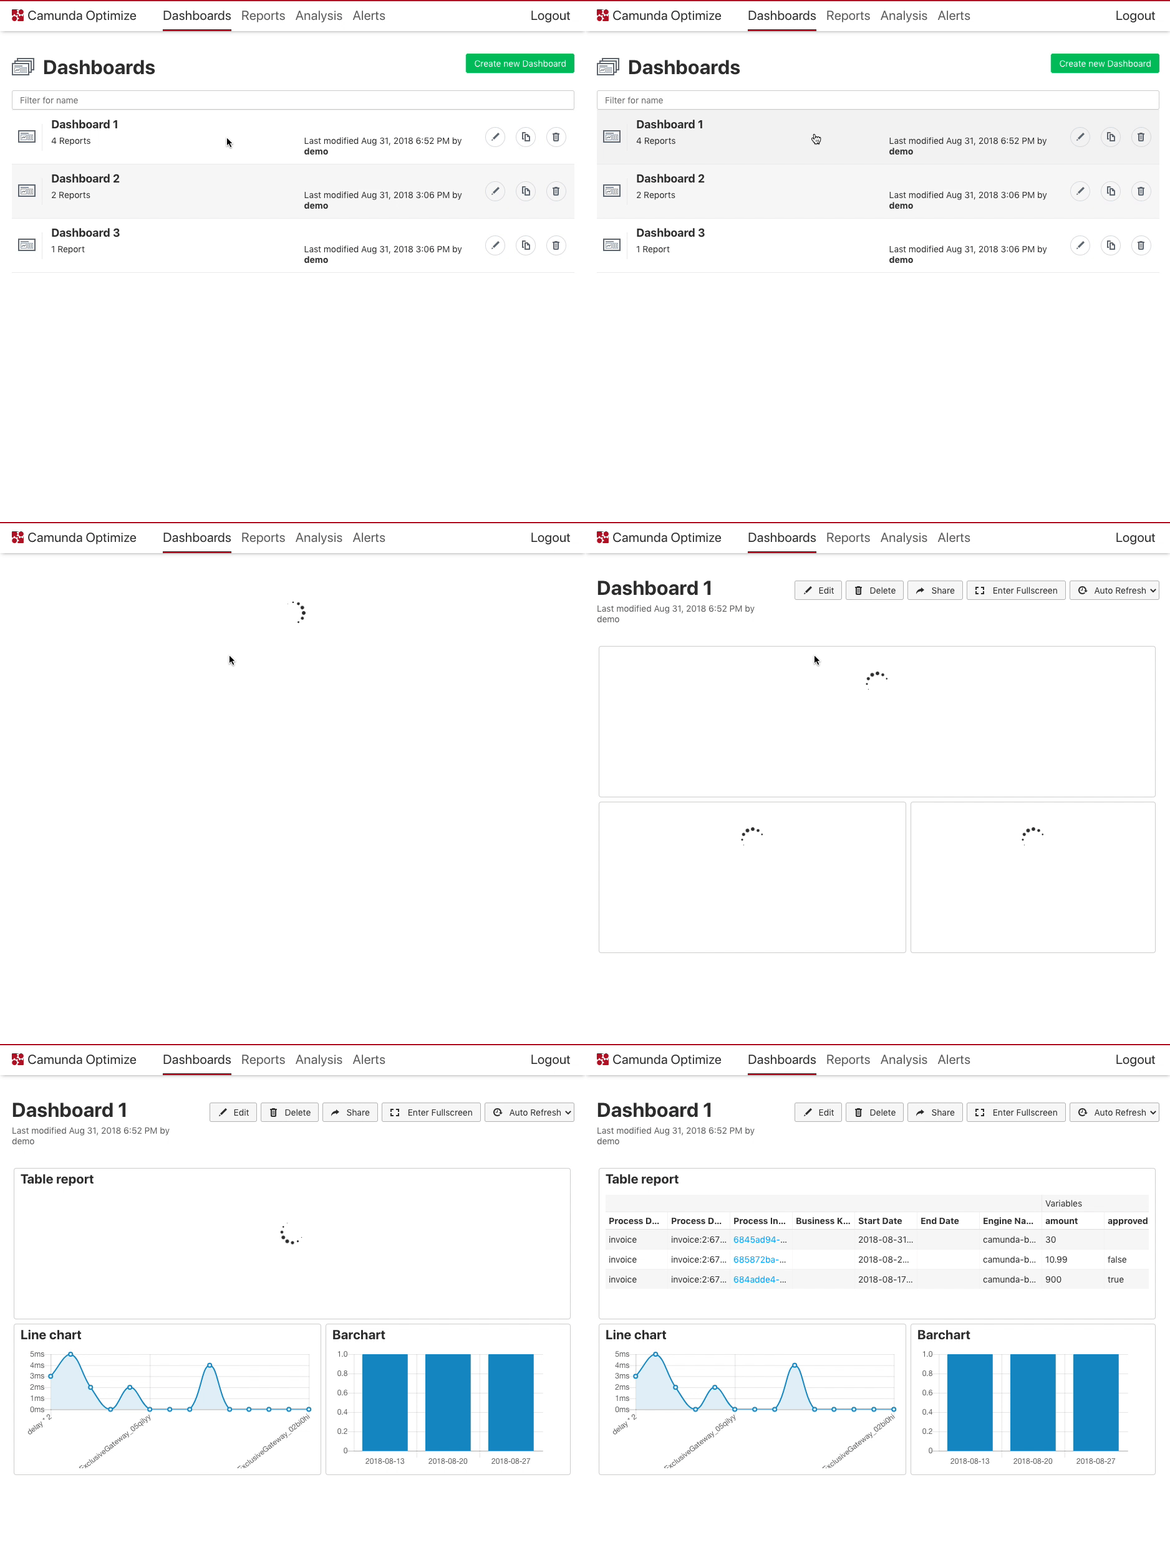
Since loading data from a server takes some time especially if the internet is slow. It is very important to inform the user that the data is being loaded from the server. Therefore, A loading indicator is added through the application that appears every time that data is being loaded.

Improve bpmn diagram performance
When using Optimize, we often need bpmn diagrams, e.g. to display the model, to extract flow node names or to enable user interactions. Sometimes, it is needed to use the same bpmn diagram in multiple place and every time a bpmn diagram is needed, it get instantiated again. Moreover, instantiating a new bpmn diagram takes relatively long time. Therefore, in this release, every time a new instance is created, it is cached in memory and When it is needed again, it is directly available and there is no need to instantiate a new instance anymore. This makes loading pages that has bpmn diagrams much faster.
How to get it
If you want to give the new Camunda Optimize a try, you can download the release with your Enterprise customer credentials. Please sign up for a free 30-day trial version.
