We are happy to announce the release of Camunda Optimize 2.5.0.
The release includes many exciting features including:
- Multi-Tenancy Support
- Improved Multi-Engine Support
- New and Enhanced Flow Node + User Task Reports
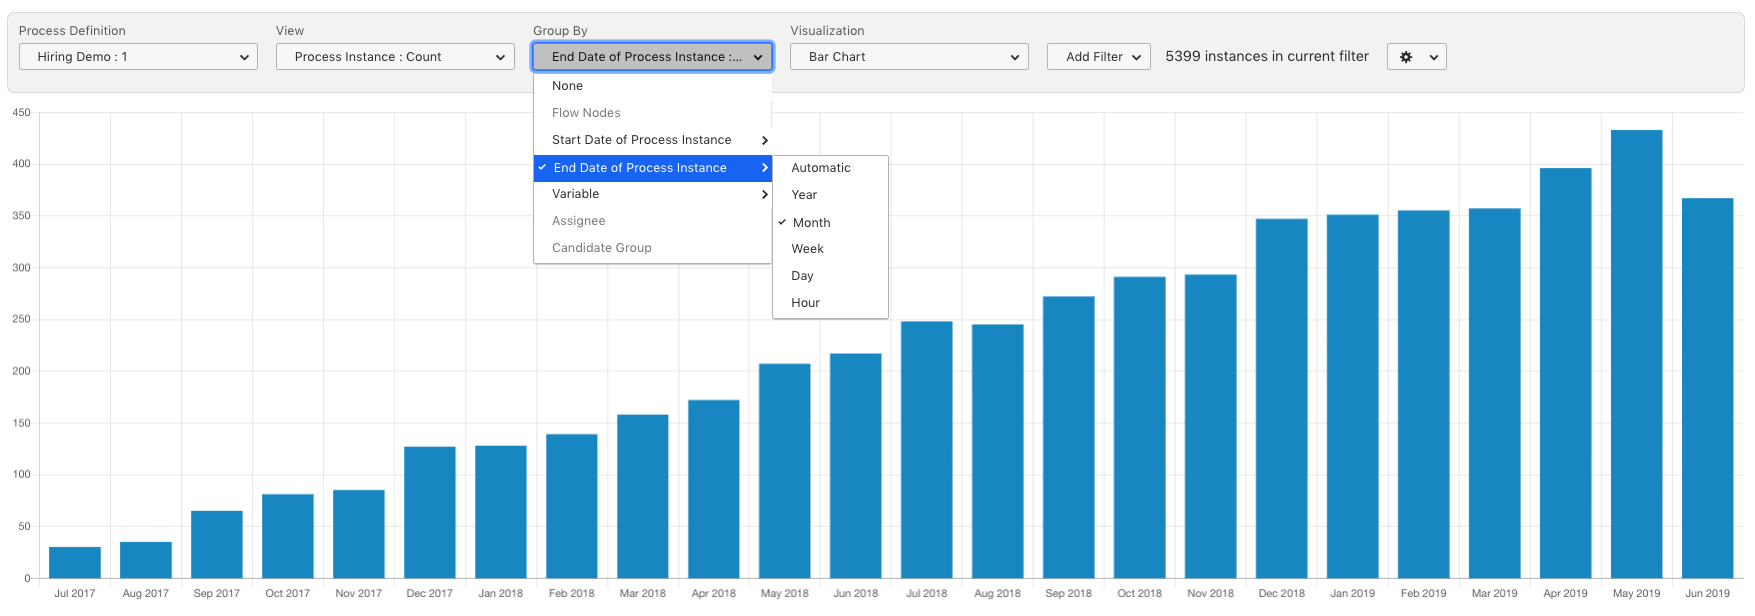
- Group by End Date
The complete release notes listing all features and bug fixes are available in Jira.
You can try out a free trial of Camunda Optimize and also register for our webinars in English and German.
Multi-Tenancy Support
Multi-Tenancy regards the case in which a single Camunda installation should serve more than one tenant. For each tenant, certain guarantees of isolation should be made. For example, one tenant’s process instances should not interfere with those of another tenant.
With Camunda BPM Runtime Platform Multi-Tenancy can be achieved in two different ways:
One way is to use one process engine per tenant. The other way is to use just one process engine and associate the data with tenant identifiers.
With this release of Optimize we add support for both Multi-Tenancy options for the first time. Let’s have a look in more detail how this looks like:
Tenant-specific Reports
In case you are working with tenants, Optimize allows you to select the tenant(s) you want to focus on within the Process Definition selection. Besides this it is possible to select “Not Defined” for analyzing process instances of the definition that have no tenant information. The Process Definition selection in the Report Builder will look like this:
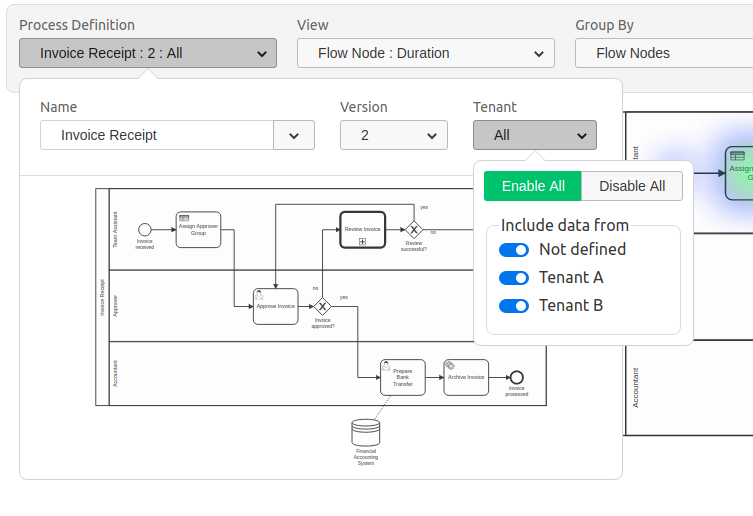
Naturally Optimize also considers authorizations for tenant specific information – meaning that if a user does not have access to a specific tenant, this tenant will not show up in the Report Builder and the user will not have access to reports that have been created by other users for this tenant.
Configuration
Depending on the chosen Multi-Tenancy option the Optimize configuration has to be adjusted:
When you are making use of the Single Process Engine With Tenant-Identifiers option, Optimize automatically pulls the relevant tenant information from the Process Engine during import. This means that there is no additional setup required.
When you are making use of the One Process Engine Per Tenant option, it is required to configure a defaultTenant for each engine that you are connecting to Optimize in order to separate data correctly. During import of historic data this information will be added automatically.
The following environment-configuration.yaml configuration snippet illustrates the configuration of this defaultTenant on two different engines.
...
engines:
  "engineTenant1":
    name: engineTenant1
    defaultTenant:
      # the id used for this default tenant on persisted entities
      id: tenant1
      # the name used for this tenant when displayed in the UI
      name: First Tenant
  ...
  "engineTenant2":
    name: engineTenant2
    defaultTenant:
      # the id used for this default tenant on persisted entities
      id: tenant2
      # the name used for this tenant when displayed in the UI
      name: Second Tenant
...
For more details regarding Multi-Tenancy we added a section in our Technical Guide.
Improved Multi-Engine Support
With this version of Optimize we also changed the way Authentication and Authorizations work when you have more than one engine configured with Optimize.
When you configured multiple engines in Optimize, each engine can host different users with a different set of authorizations. If a user is logging in, Optimize will try to authenticate and authorize the user on each configured engine.
To determine if a user is allowed to log in and which resources he is allowed to access within the Multi-Engine scenario, Optimize uses the following algorithm:
Given the user X logs into Optimize, go through the list of configured engines and try to authenticate the user, for each successful authentication fetch the permissions for this user from that engine and allow the user to access Optimize if authorized by at least one engine.
For the first time this allows you to make use of Optimize in a Multi-Engine setup while ensuring that authorizations and authentication work as intended when having different authorizations per Engine and per processes.
For more details regarding Authentication and Authorizations we updated the section in our Technical Guide accordingly.
Flow Node + User Task Report Enhancements
Being able to analyze Flow Node and User Task information efficiently helps identifying bottlenecks and continuously speed up process execution.
Therefore, we are happy to add more support for Flow Node and User Task analysis with this release.
State Configurations (Running + Completed State)
Flow Nodes (including User Tasks) can have the execution states running and completed. For reporting and monitoring purposes, it is critical to be able to distinguish both states in order to create meaningful reports.
With this release we allow users to distinguish between running and completed Flow Nodes.
You can configure your report to include running, completed or Flow Nodes with both states by opening the Configurations Options Popover and choosing one of the three options in the Dropdown:
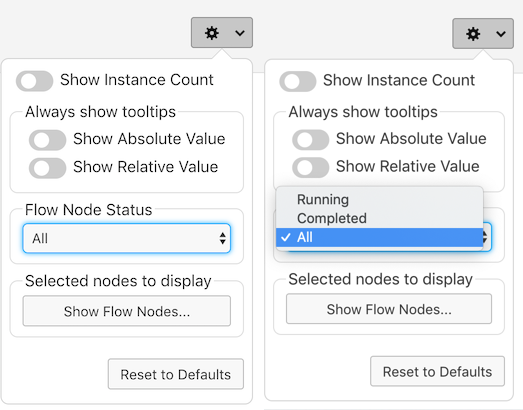
With the help of this configuration option we could e.g. create a combined reports comparing the number of completed and running Flow Nodes:
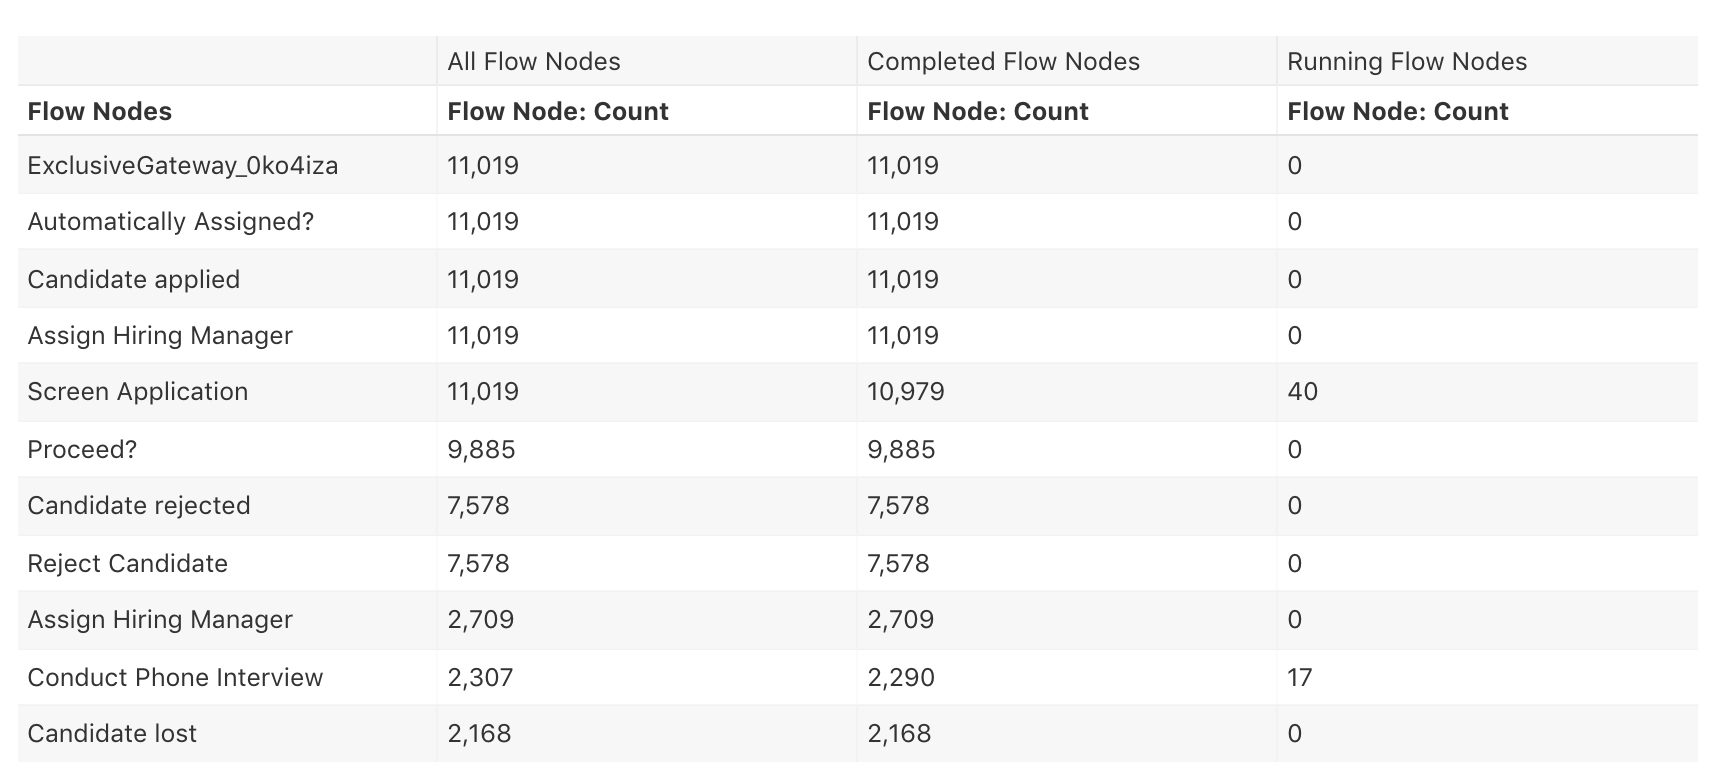
This report can help us to identify where our instances are stuck or where many of them are waiting.
Running Flow Nodes Durations
Until this release it was already possible to analyze durations of completed Flow Nodes (including User Tasks). As for continuous process improvement and monitoring purposes, running Flow Nodes and User Tasks are also very important, we added the duration for running Flow Nodes and User Tasks, too. In combination with the above mentioned configuration option it is now possible to create reports that focus on running flow durations.
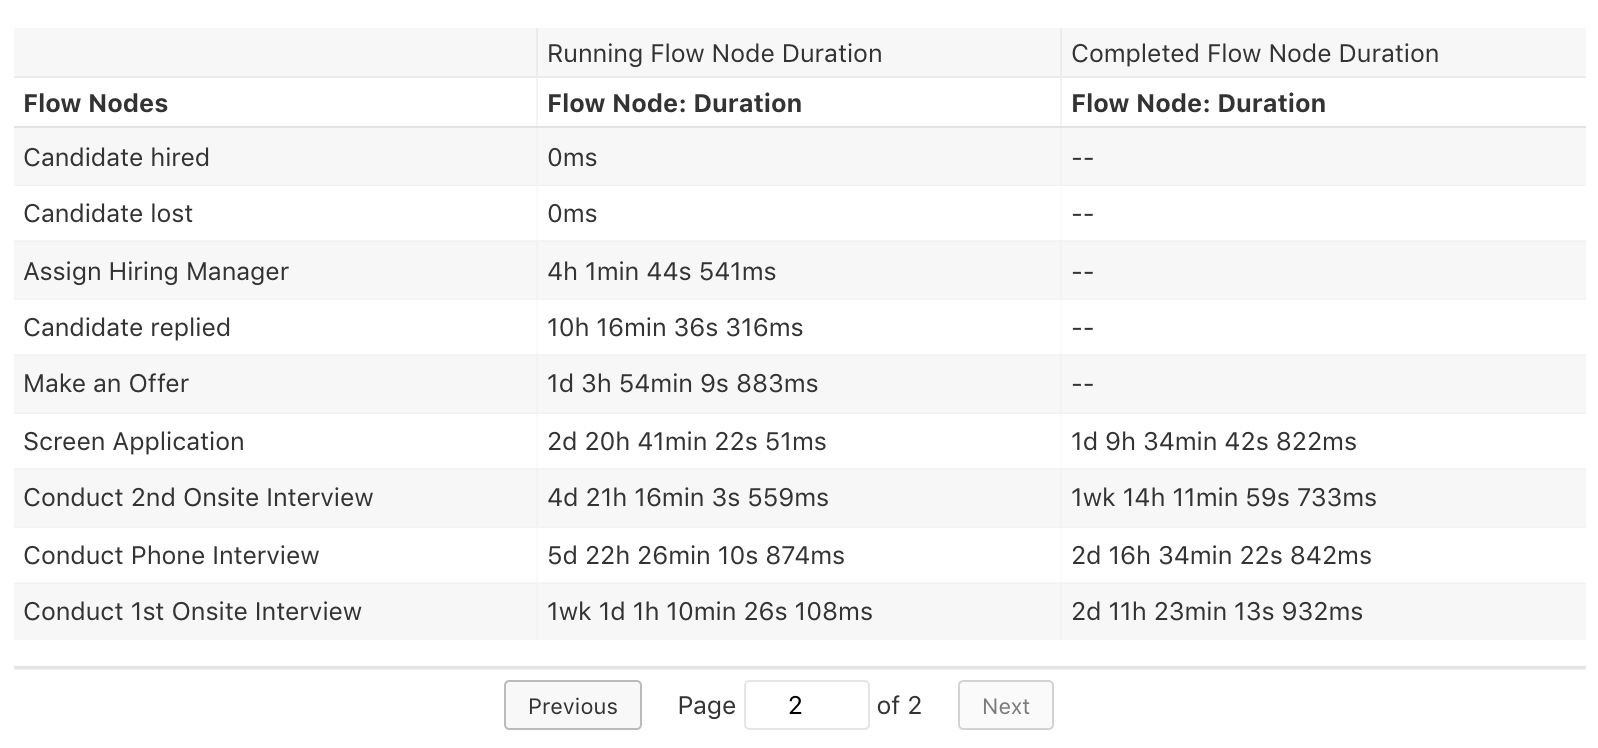
This feature becomes even more valuable in situations when you are interested in the idle or work time of running User Tasks and want to make sure that certain User Tasks are not taking too long.
User Task Assignee + Candidate Groups
User Tasks play an important role in most processes that are being automated with Camunda BPM today. With Optimize 2.4 we added more support for User Tasks and made the Idle, Work and Total times of User Tasks available in Reports.
With this release we go a step further and import additional valuable information to Optimize. This includes User Task assignees and candidate groups. Based on this data Optimize allows you to create new exciting reports:
First of all you can easily see how the User Tasks are distributed across the different users of your process.

With additional configuration this even allows you to see which user is currently working on many User Tasks and which ones have only few assigned.
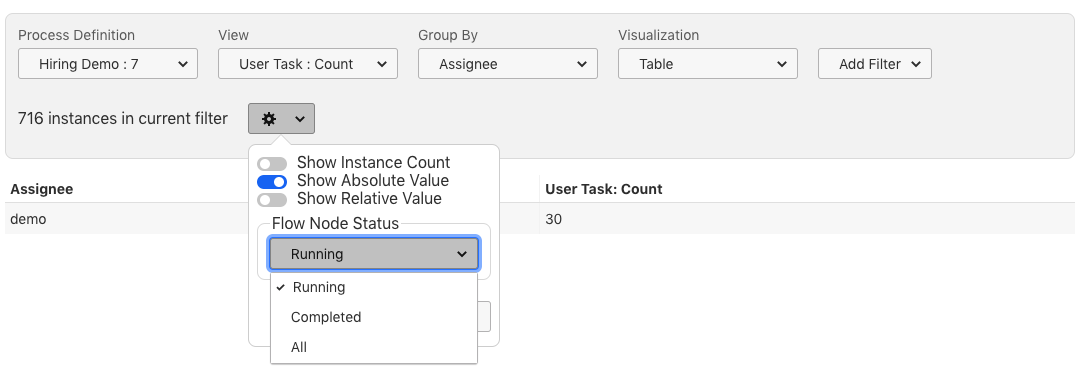
Before a User Task is claimed by a specific user, usually a candidate group(s) is assigned. With the help of group by Candidate Group you can identify how the tasks are distributed – for running, completed or all User Tasks.

The same functionality is also available for User Task durations. The User Task Duration Time settings can now be found in the Configurations Options Popover as you can see in following screen:
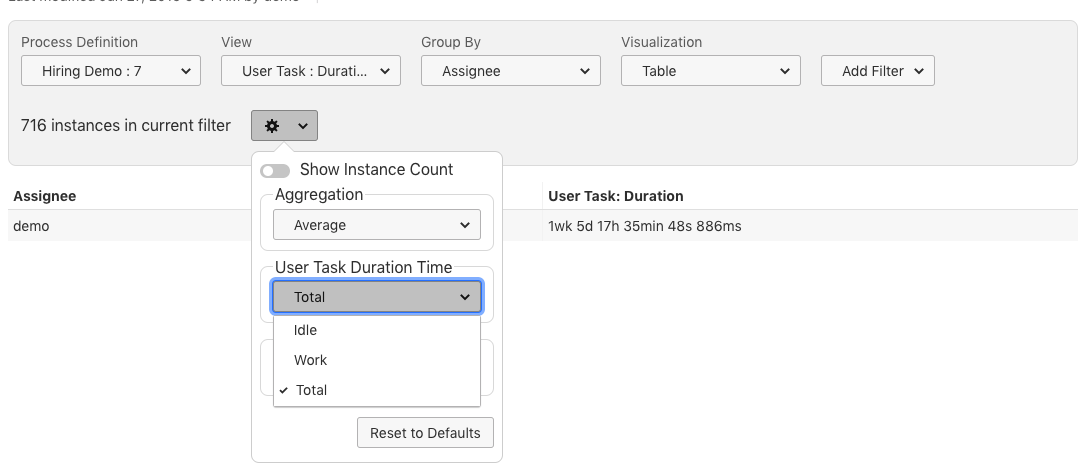
These features can support you analyzing and improving the work load across different teams and users, hence speeding up process execution a lot.
At the same time for some organizations it might not be allowed to analyze user specific information. Therefore, Optimize allows you to disable the import of this historic information by changing the flag import.data.user-task-worker.enabled to false in the configuration.
Show + Hide Flow Nodes
When looking at Flow Nodes and User Tasks per default you will see all Flow Nodes and User Tasks. Especially working with larger or more complex processes requires to focus on relevant information. With this release we add the possibility to hide certain Flow Nodes that are not relevant for your report.
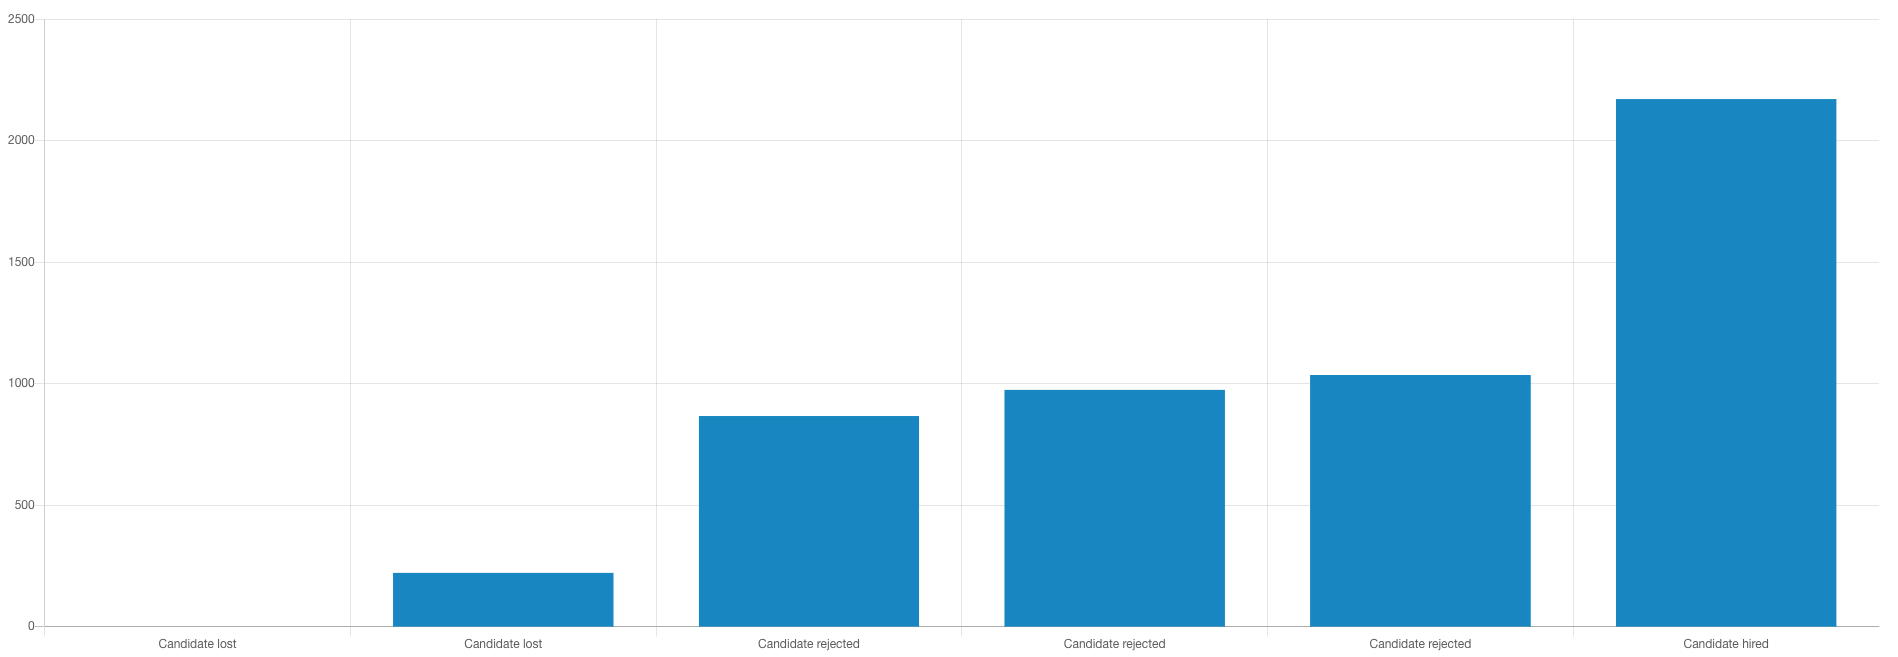
Imagine a Hiring Process which can have different End Events (e.g. Candidate Hired or Rejected), then you might need to report the distribution of instances across the different outcomes of the process to upper management. You can now build a report that focuses on the Flow Nodes or User Tasks which you select:
Within the Configurations Options Popover you will find a new Button which leads you to the selection overlay.
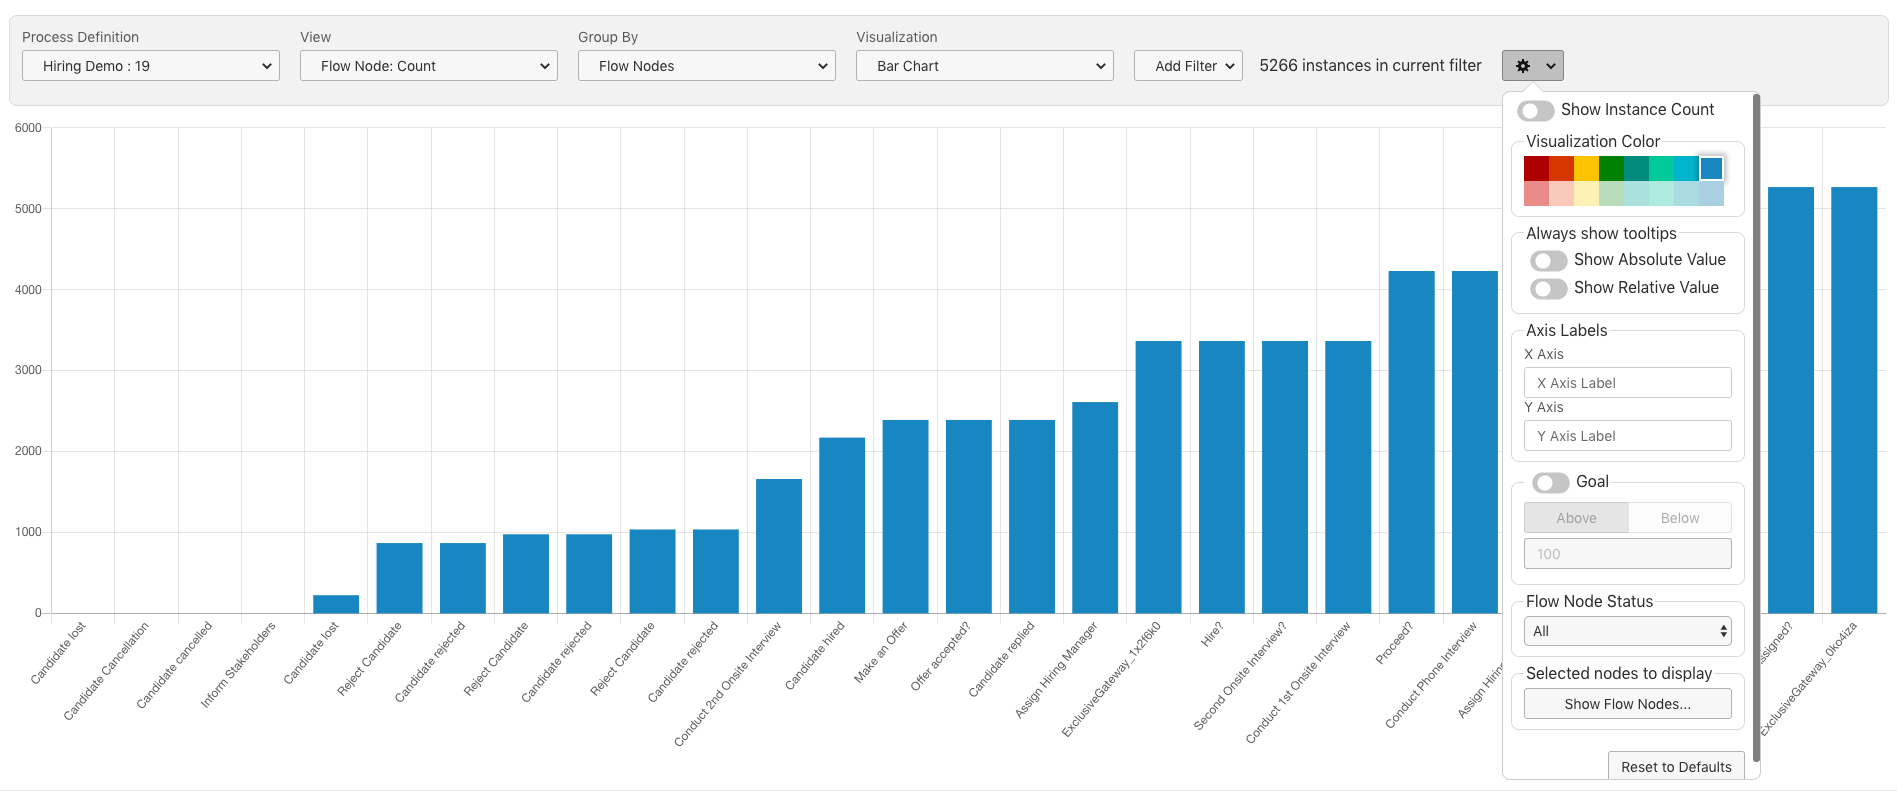
You can make your selection by just clicking on the relevant Flow Nodes.
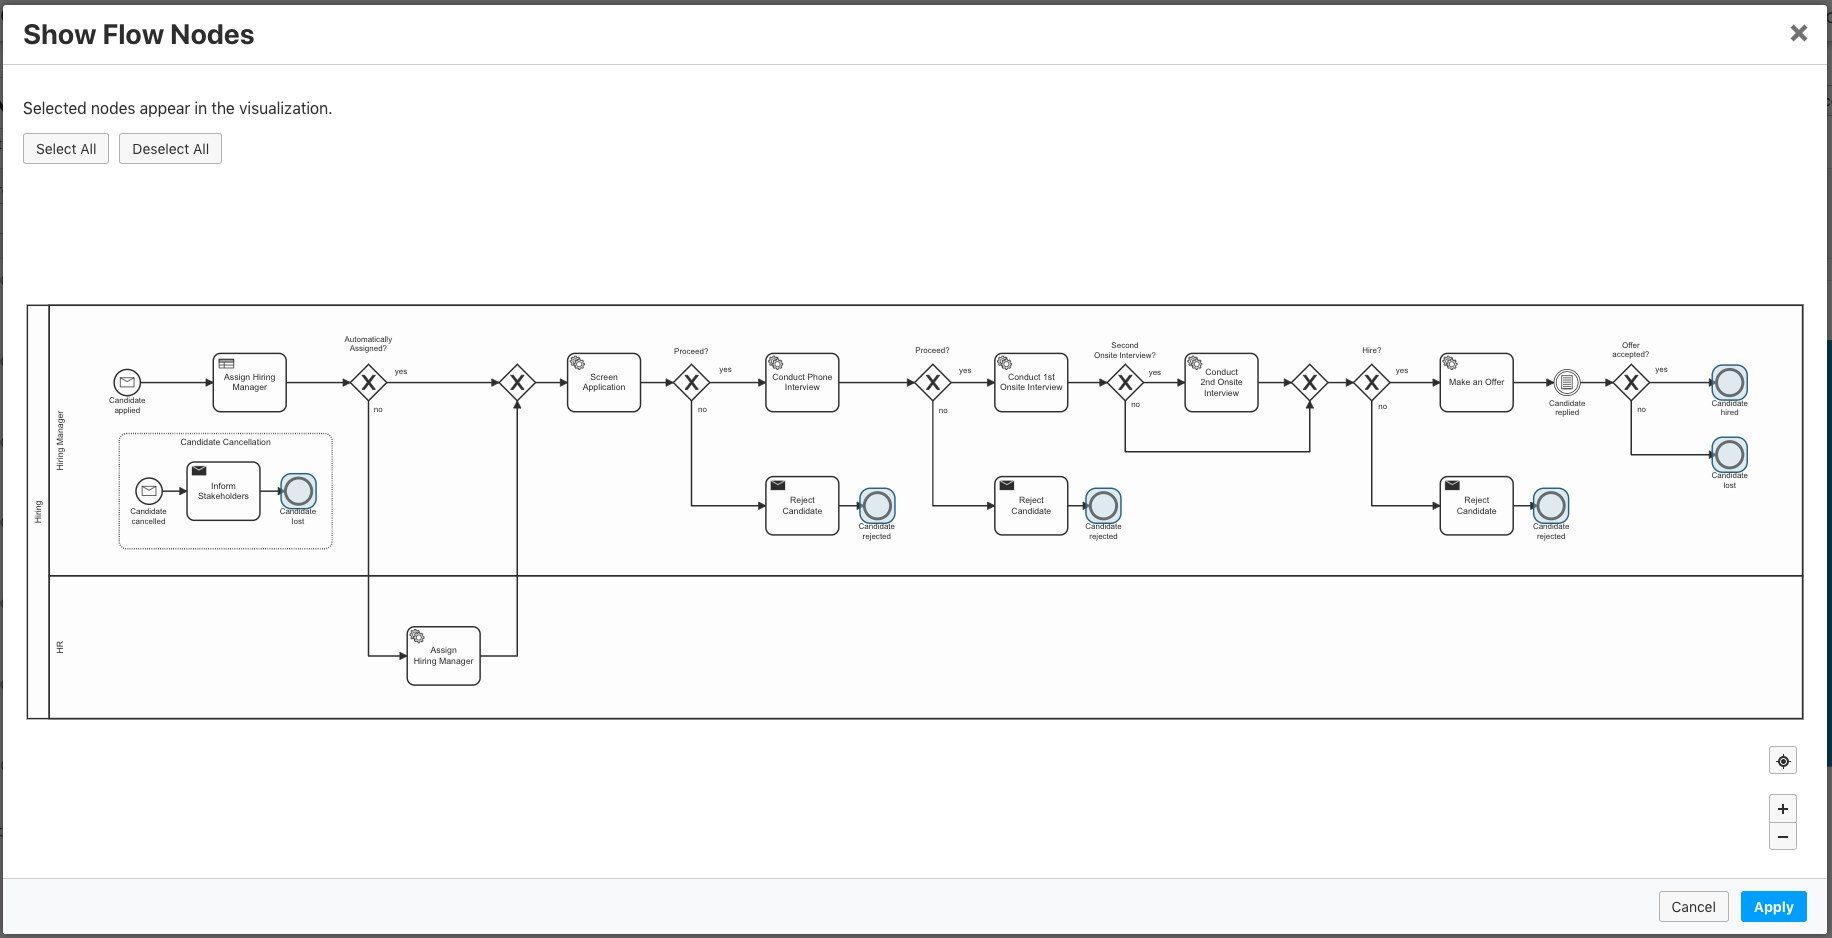
The result is a Flow Node Report focusing on the Flow Nodes that are relevant for you – in our example the End Events of the Hiring Process.
Group by End Date Reports
With this release we add the possibility to group process instance counts and durations by end date. This allows you to see how many instances have been completed in a certain period of time:
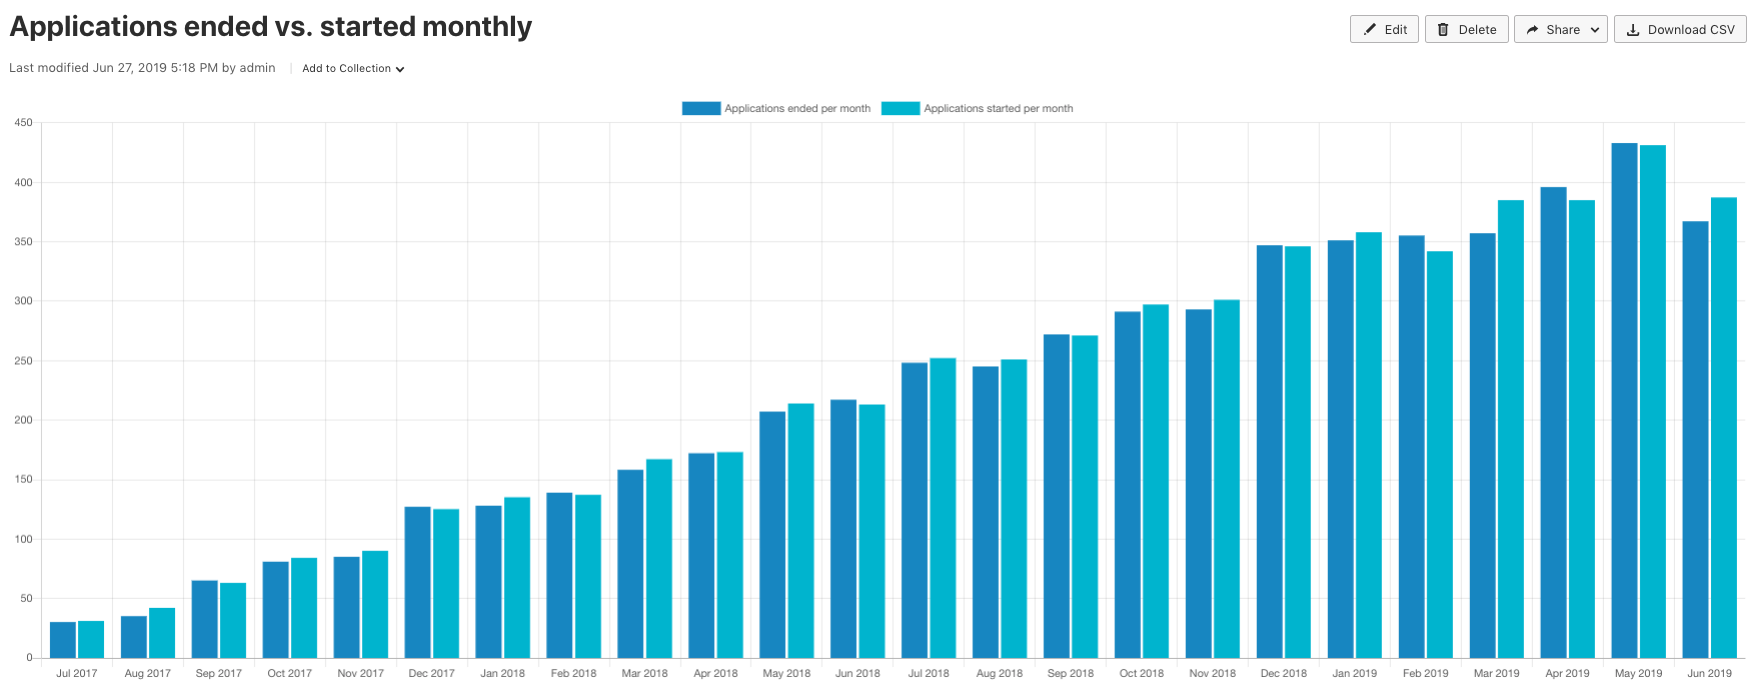
In combination with a report that groups by start date we can see easily how many instances have been started and how many have been ended in a certain period of time. This allows us to identify quickly if we completing instances quickly enough:
Supported Environments
With this release we also add official support for running Optimize on Java 12.
Additionally, we expand our support for ElasticSearch to versions 6.6.0+, 6.7.0+ and 6.8.0+. You can find the full list of supported environments in our Technical Guide.
How to get it
If you want to give the new Camunda Optimize a try, you can download the release with your Enterprise customer credentials. Camunda Optimize is part of Camunda Enterprise, so please sign up for a free 30-day trial version.
If you’re new to Optimize, we recommend that you watch the Getting Started with Optimize in less than 5 Minutes video.
Register for the Webinar
If you’re not already registered, be sure to sign up for a spot in our free release webinars, which is offered in English.
