We are happy to announce the release of Camunda Optimize version 2.6.0.
The release includes many exciting features including:
- New User Permissions Concept
- Outlier Analysis
- Enhanced Reporting
- Multi-Version Support for Process and Decision Reports
- Durations for Running Process Instances
- New User Task Assignee & Candidate Group Reports
- Improved Support for Undefined and Null Variable Values
- Supported Docker Image
The complete release notes are available in Jira.
You can try out a free trial of Camunda Optimize.
New User Permissions Concept
Before Optimize 2.6, every collection, report or dashboard that was created in Optimize was per default visible for all users and could also be edited by all users.
In certain scenarios this could lead to problems because, for example, you could update reports and dashboards from other users without them being aware of it.
At the same time it was relatively difficult to keep a good structure of reports and dashboards in the past.
With this release we made major changes to how access to the entities in Optimize work and how collections can be used.
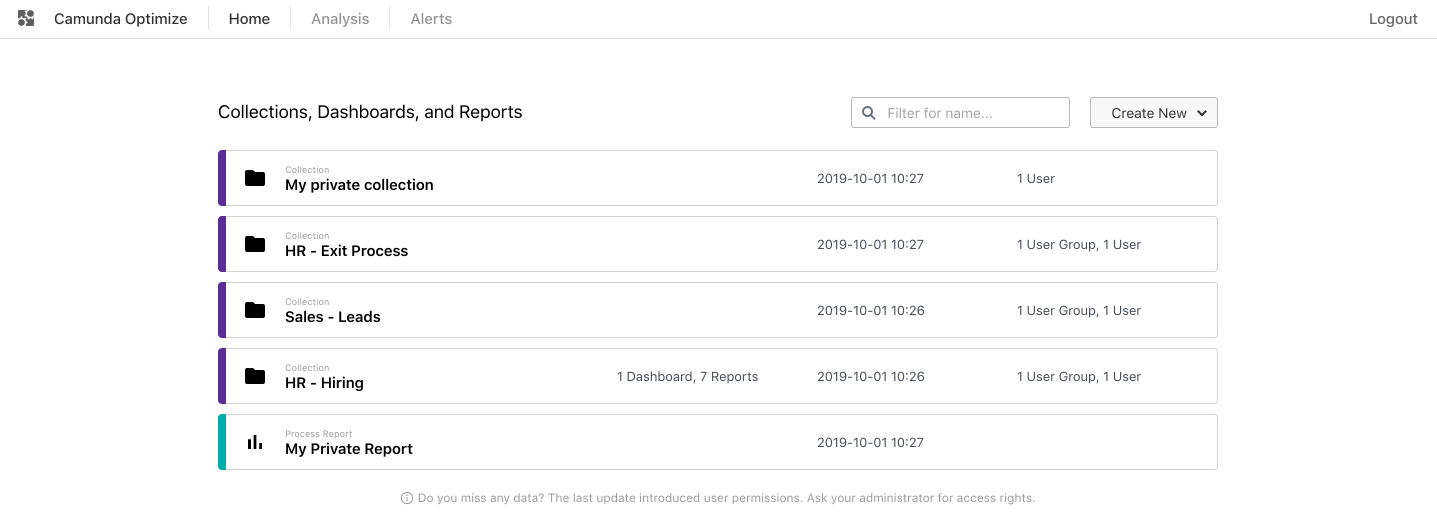
From this release onwards collections, reports and dashboards will be private per default. This means that other users will not be able to see or edit them.
In order to reflect the new concept we modified the Reports & Dashboard page which is called Home now:
To allow other users to view or edit reports and dashboards, you can place them in a collection. Each collection has a dedicated page:
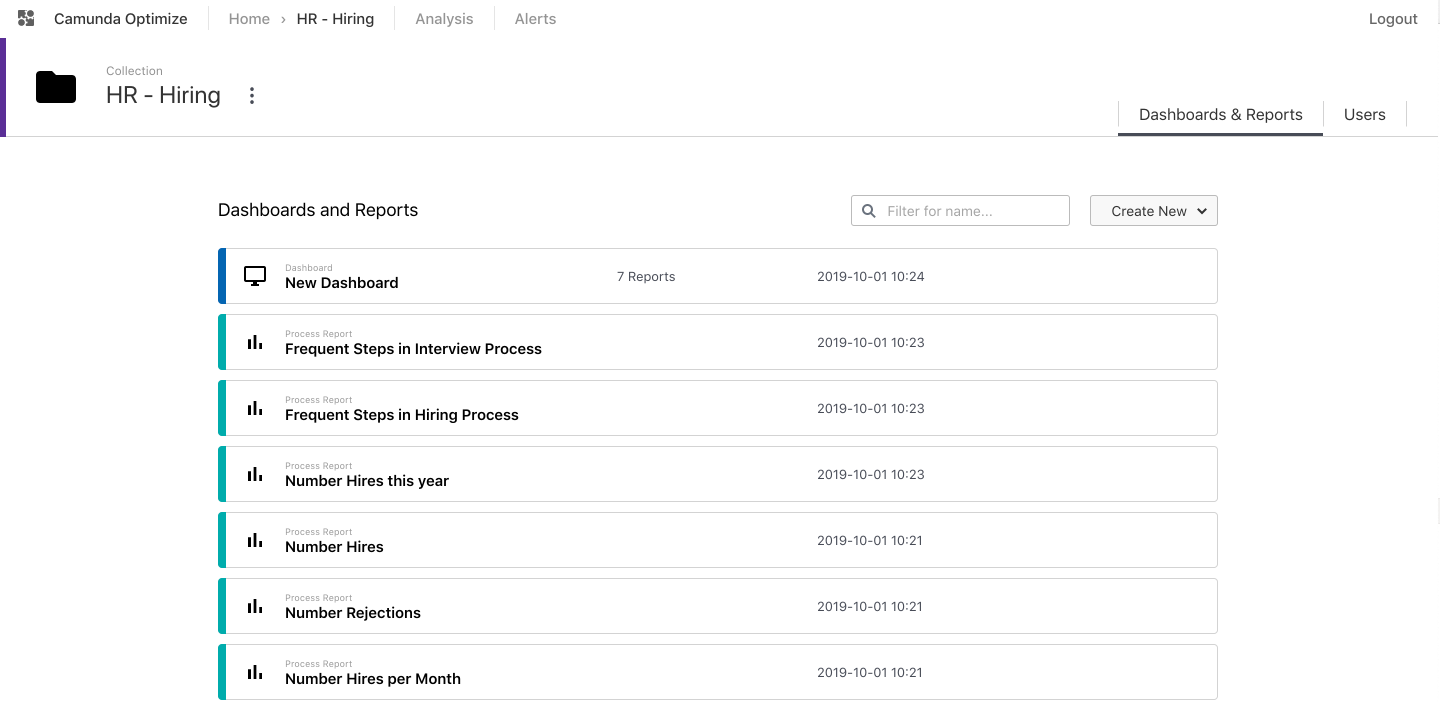
The new breadcrumb in the header reflects the way you navigate to your report, dashboard or collection. This allows you to easily navigate between the different pages.
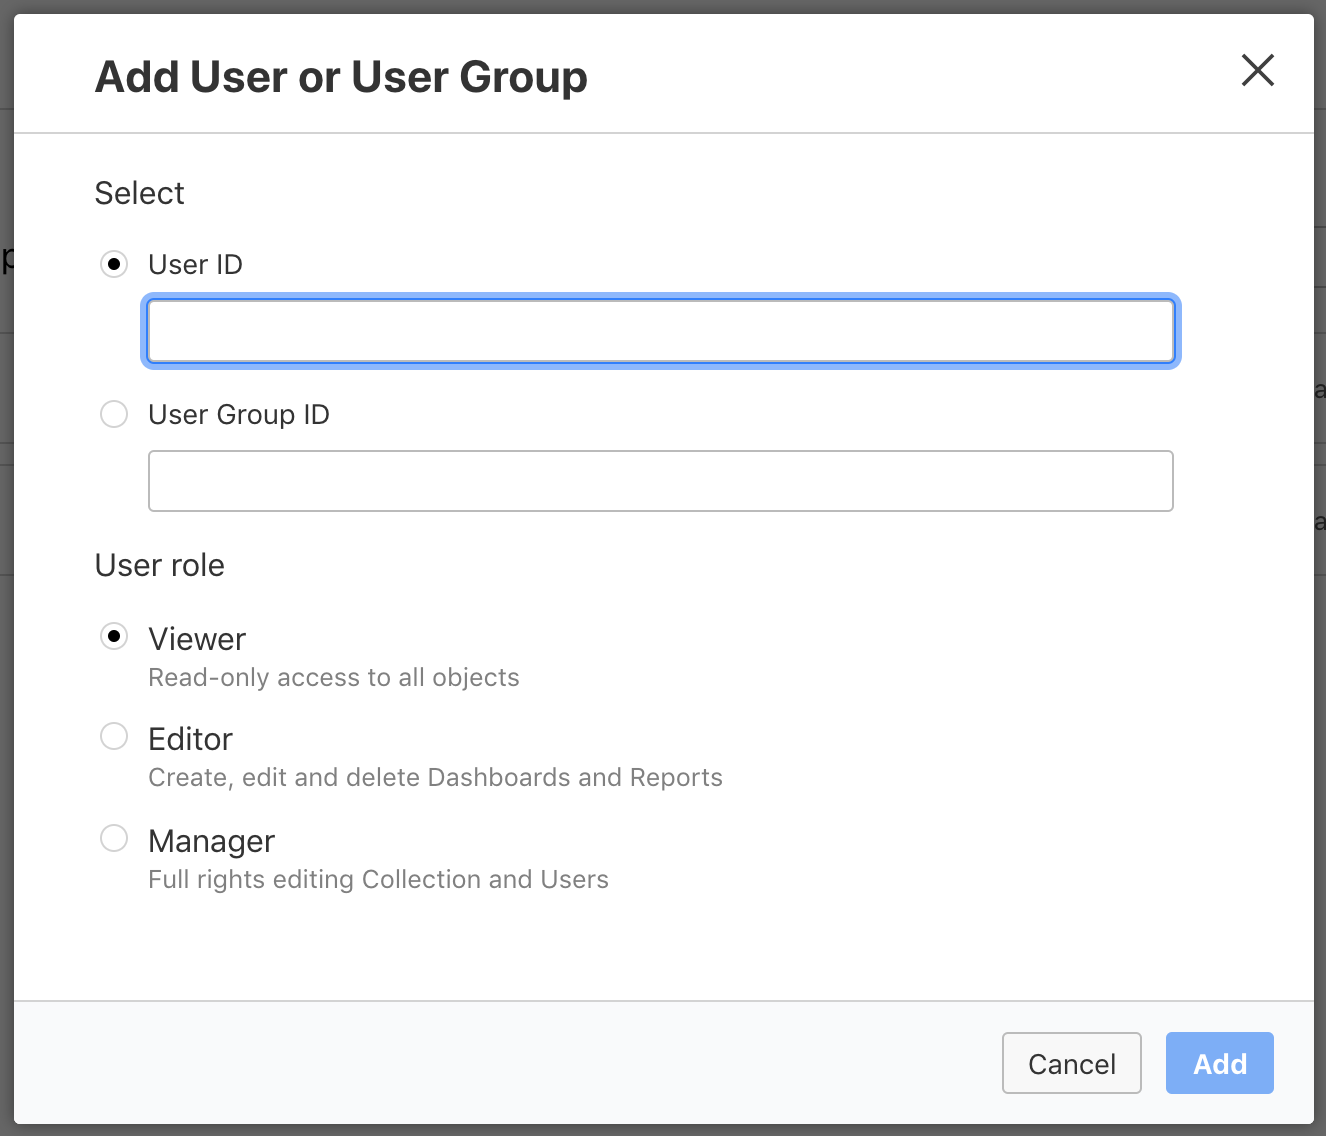
After creating your collection you can add users and groups to it:

While adding users or user groups to a collection, you have to choose one of the roles for the added user or user group:
- Viewers can only view the collection and all reports and dashboards within the collection.
- Editors can additionally edit all reports and dashboards within the collection, but not the collection itself.
- Managers can edit all reports and dashboards and also manage the collection.
If you are upgrading from an older Optimize version then you might have to place your existing reports and dashboards inside a collection and share them with the right users.
Outlier Analysis
Optimize 2.6 allows you to inspect the average, minimum, maximum and median durations of flow nodes within your processes.
Using the heatmap visualization you are able to compare the durations with target durations that can easily be set directly in Optimize.
With this release, we added an exciting feature which allows you to easily identify process instances where certain flow node instances are taking significantly longer than others and subsequently slow down your process.
We call this Outlier Analysis. Let’s have a look into the feature based on a step-by-step example.
When using the new Outlier Analysis feature within the Analysis section, and selecting the process, we can directly see that the Heatmap highlights the flow nodes where Optimize identified many duration outliers. In our example for the Tasks Assign Hiring Manager, Screen Application and Conduct 1st Onsite Interview duration outliers were identified.
When hovering over the task you can see how many instances were identified and how much longer they took than the average duration.
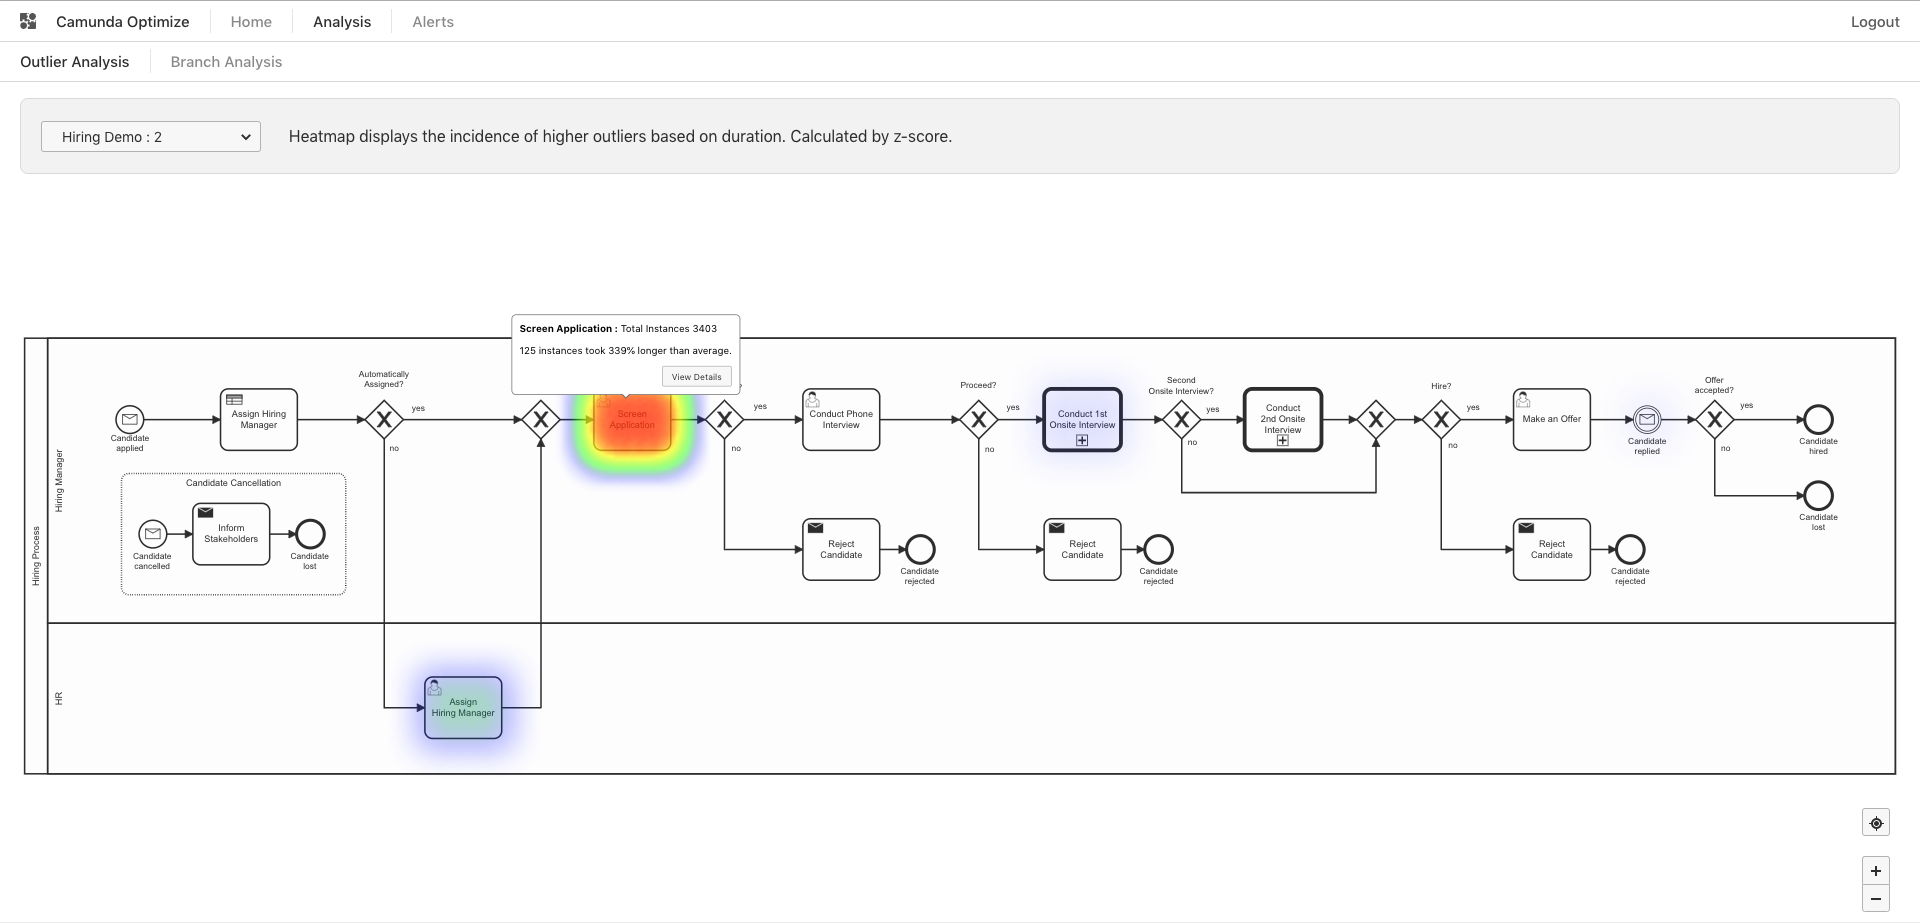
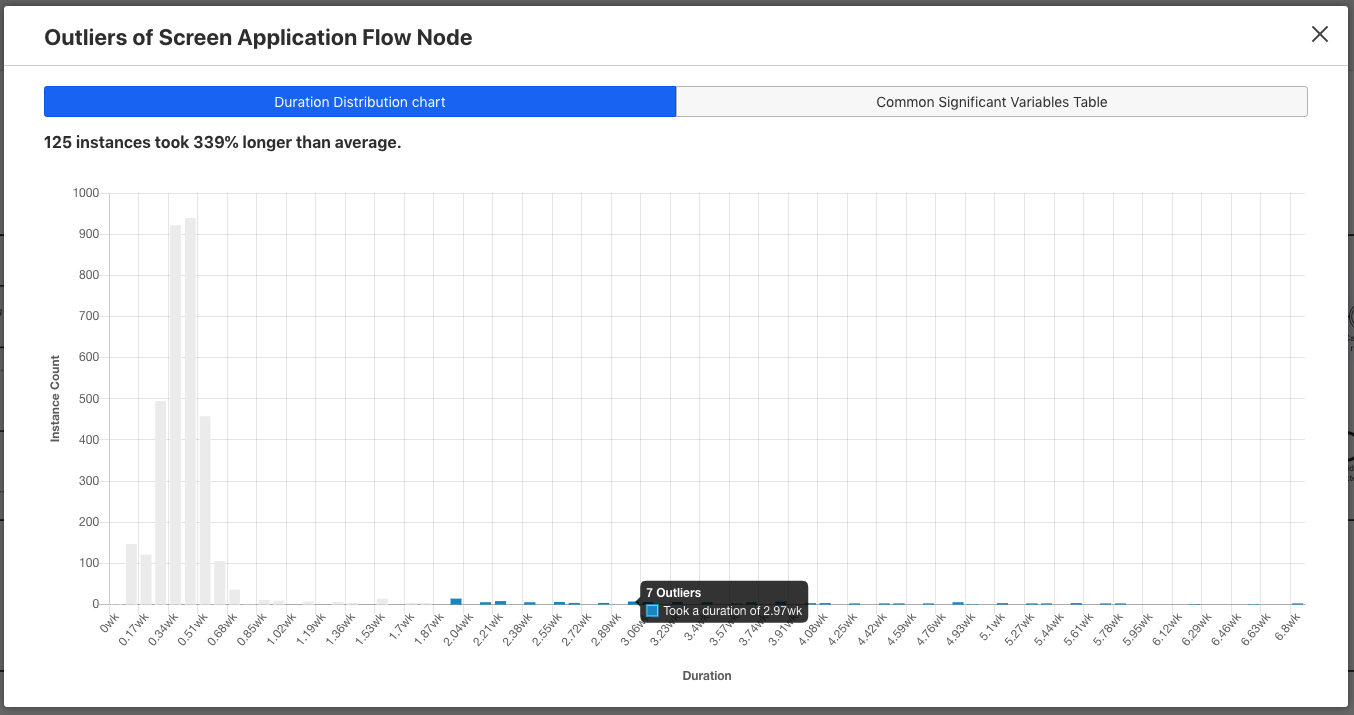
A click on View Details allows you to directly see a Duration Distribution Chart for the specific flow node. The Duration Distribution Chart shows you how long the identified outliers take – also in comparison to the other flow node instance durations.
Significant Variable Values
When looking at the duration outlier instances you can analyze the data further in order to find the root-cause of why these instances eventually took so long.
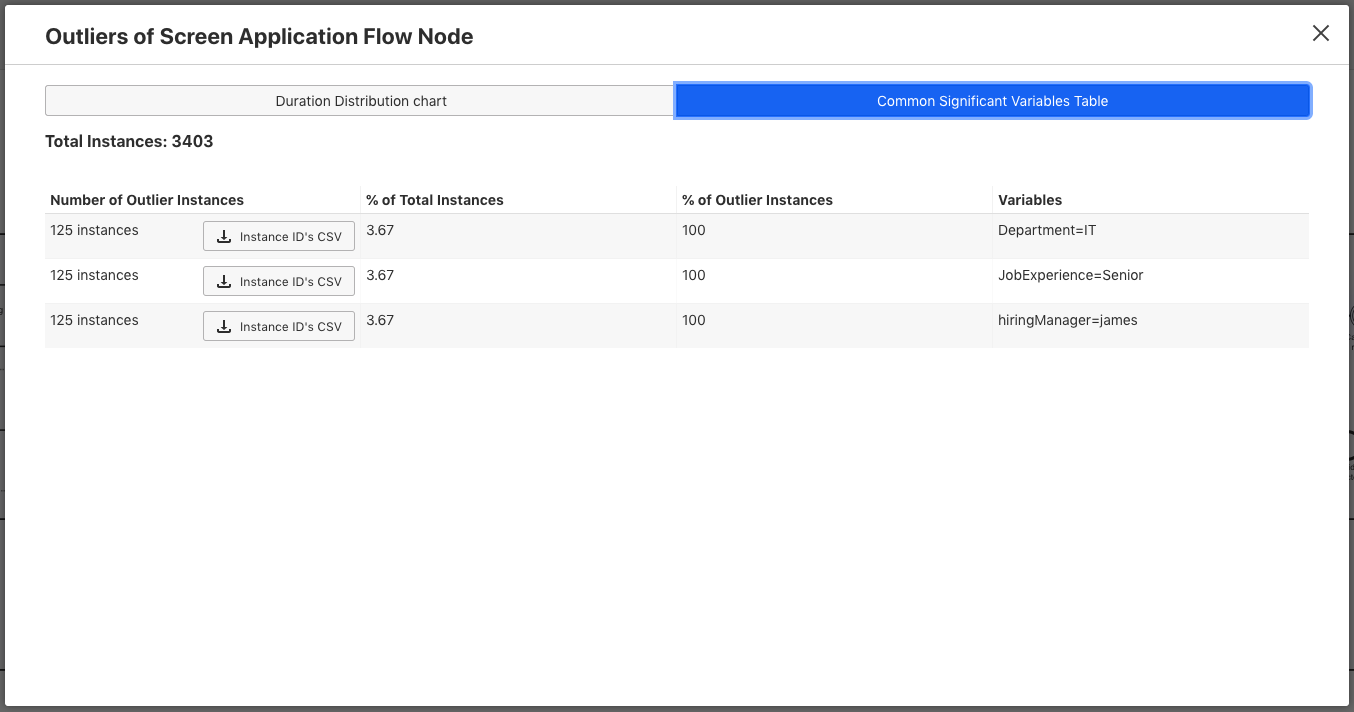
A click on the significant variables tab shows a table that lists significant variable values in the outlier instances. It also allows you to see how many times this variable value occurred in the outlier instances compared to the rest of the process instances. This can give you a good idea if there is a correlation between a variable value and a flow node taking more time than expected.
In our example we can see that for all of our Duration Outliers the Department was IT, the JobExperience was Senior and the assigned hiringManager was James. We could approach James to find out why it took so long to complete this task in order to speed up our Screen Application tasks.
Enhanced Reporting
Besides building out our Analysis features and our new Permissions Concept, we also improved the Reporting functionality in Optimize in different areas.
Multi-Version Support for Process and Decision Reports
The Camunda BPM Platform supports versioning of process and decision definitions. Whenever you deploy a modified definition to the engine it will automatically increase the version of this definition.
Before this release, Optimize already allowed you to create reports for a single version or for all versions at the same time.
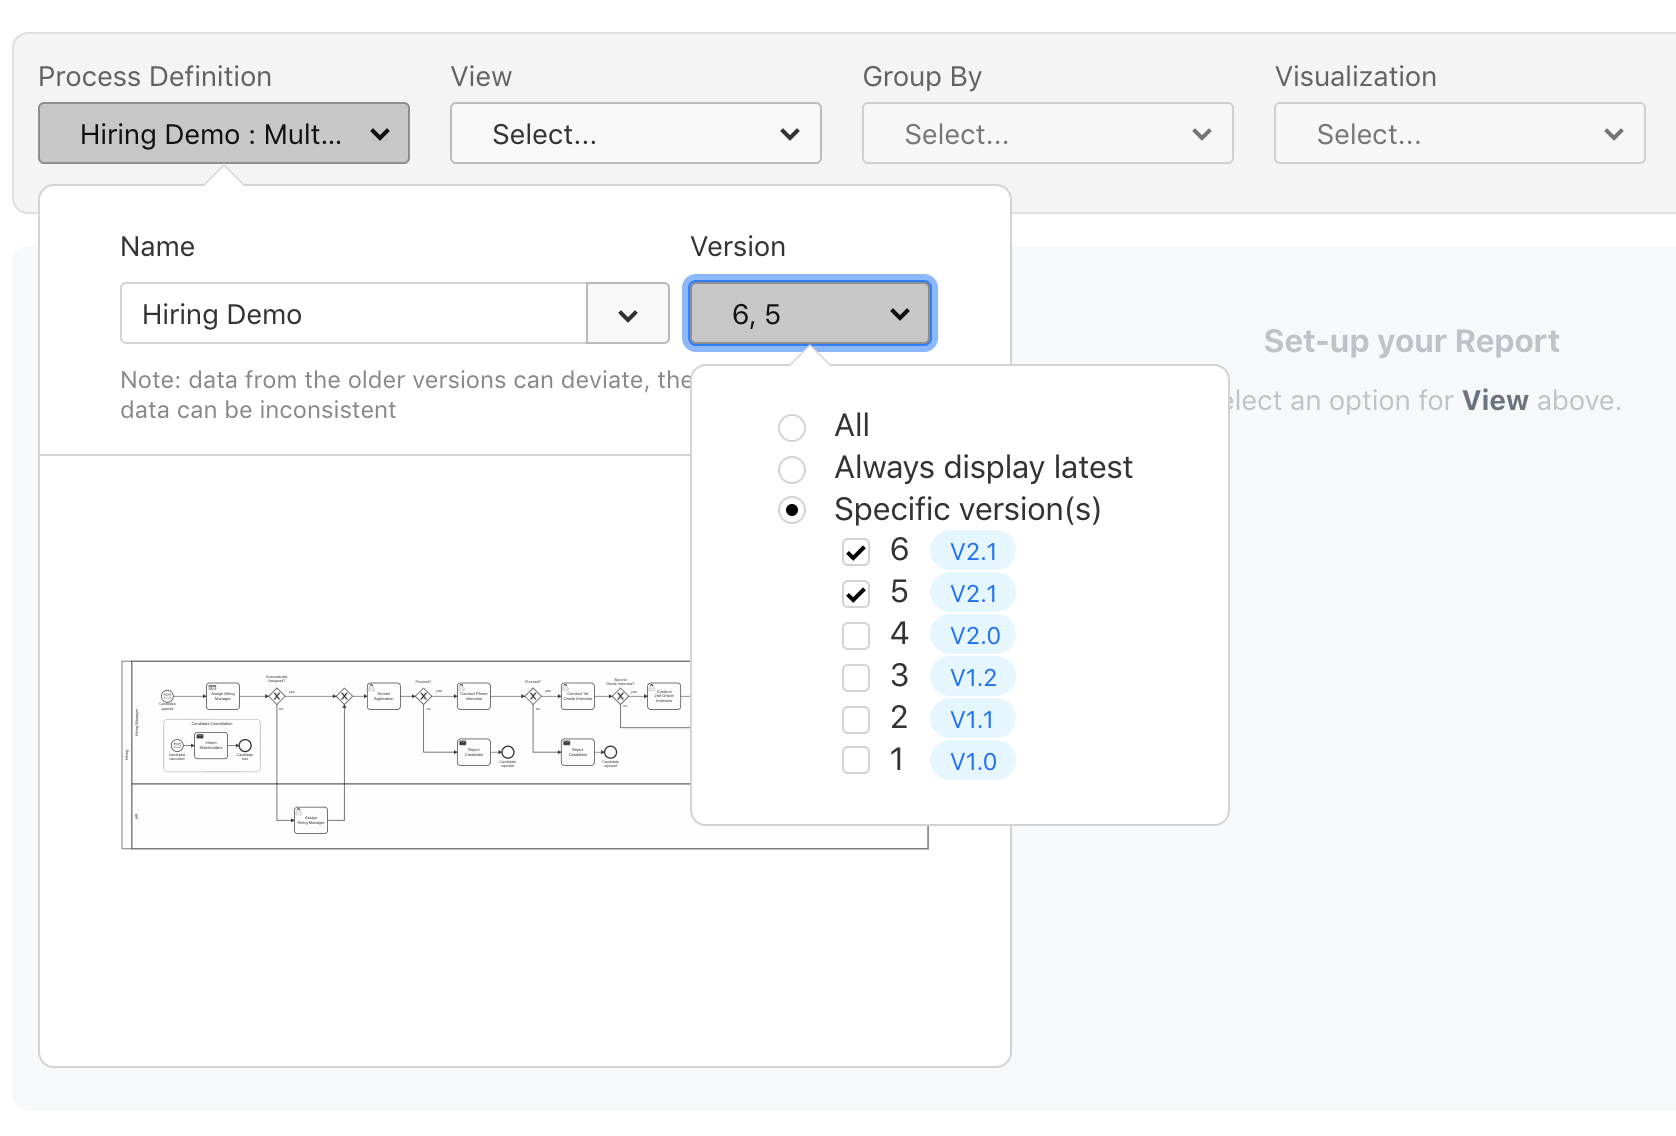
For many use-cases, users need more flexibility for selecting versions for a report. Hence with this release we allow the user for the first time to select multiple versions of the same definition when creating a report.
The Camunda Engine additionally allows you to tag a process definition with a version tag attribute. This allows you to make small fixes or changes to your definition and keep a business-related version at the same time.
With this release we add the Version Tag to Optimize. This allows users to select all definition versions with the same Version Tag for a specific report.
In addition to that we added support for selecting the latest version of a definition automatically. This feature is especially useful in situations when you regularly deploy new versions of your process or decision definitions but always want to look at the latest version in your reports. In the past you had to update the reports manually after a deployment if you wanted to achieve the same effect.
Durations for Running Process Instances
Durations of process instances are a very important base for process improvements.
So far in Optimize it was only possible to look at the duration of completed process instances.
With this release we allow users to look at the duration of running process instances.

This feature also has direct influence on the process instance duration filter, as it now also supports running process instances.
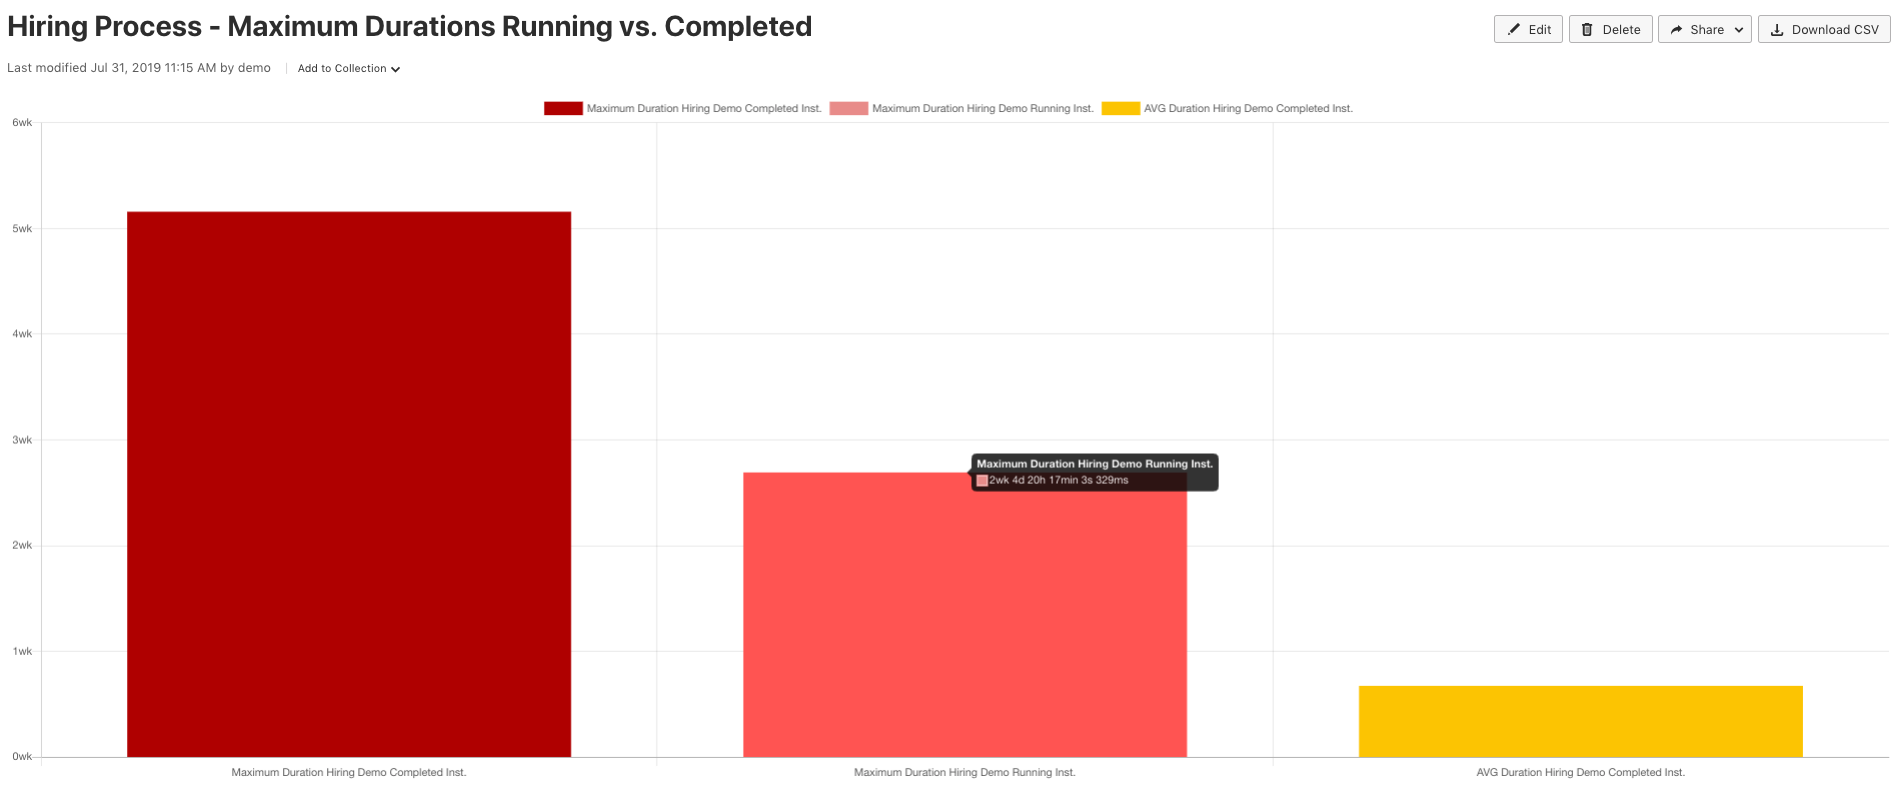
Additionally, you can easily compare durations of running process instances with durations of completed instances in a combined report which allows you to see if your running instances are taking longer than completed instances.
New User Task Assignee & Candidate Group Reports
Before this release we added multiple features which support analyzing User Tasks, including information regarding assignees, candidate groups as well as idle, work and total durations. Based on these features you were able to look at the running and completed user task counts and durations per user, which allowed you already to see how large the workload a current user has and how much they completed in the past.
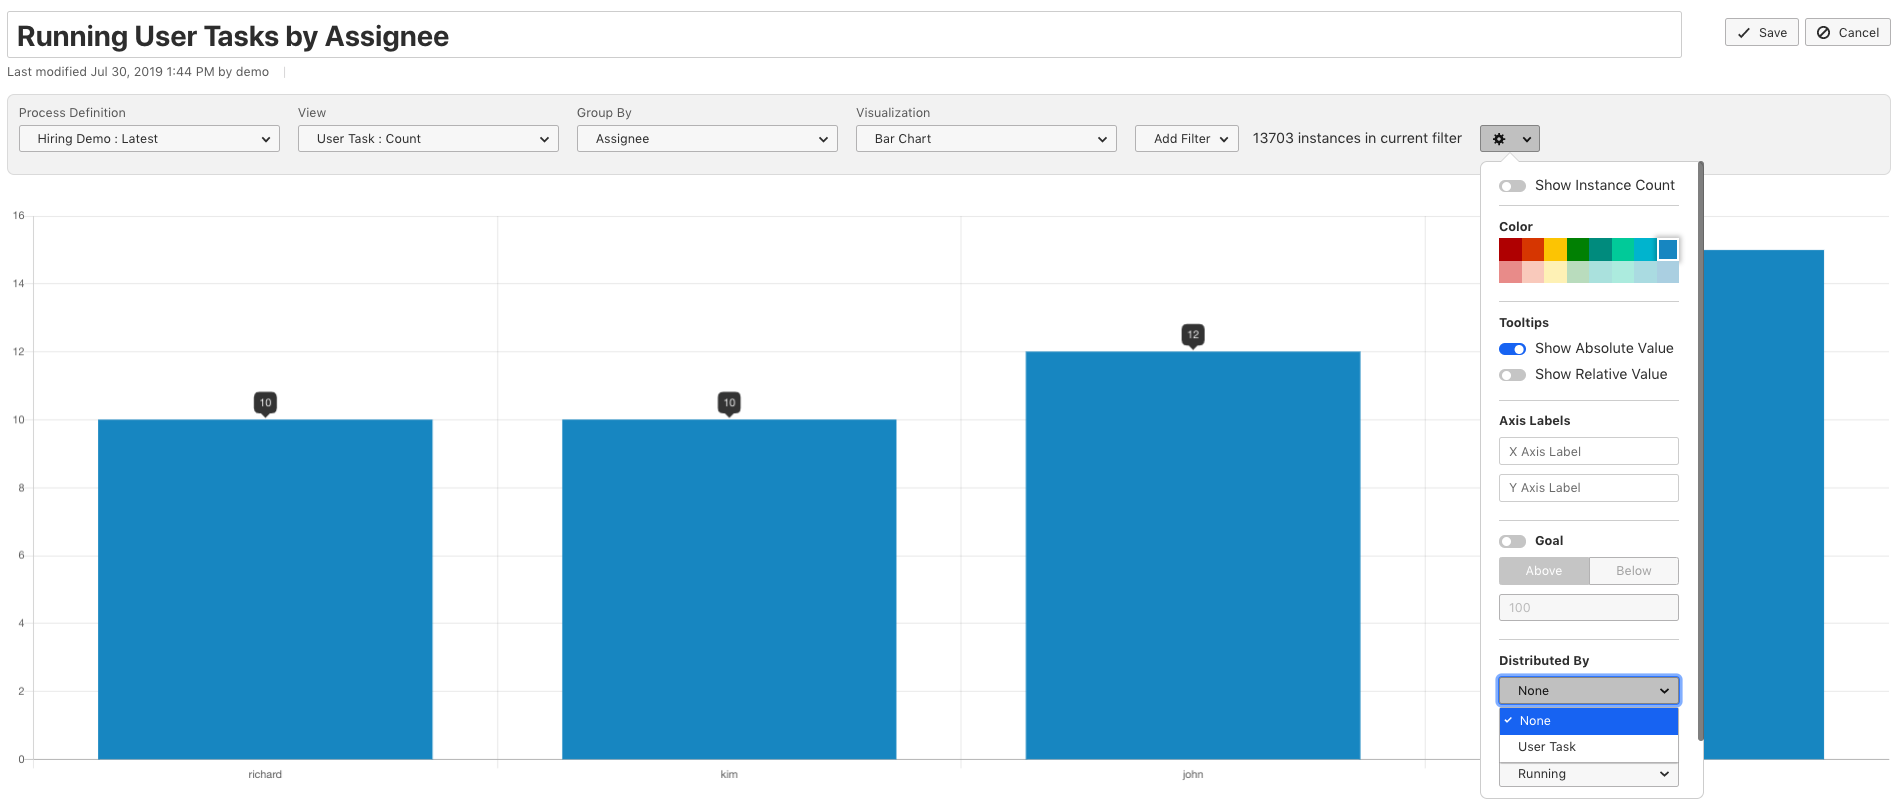
With this release we add the possibility to distribute this information by User Tasks, which helps you to see which User Tasks of the Process your users are working on or have completed in the past. To allow both (distribution by User Task and no distribution) we added a new option in the configuration popover as you can see below:
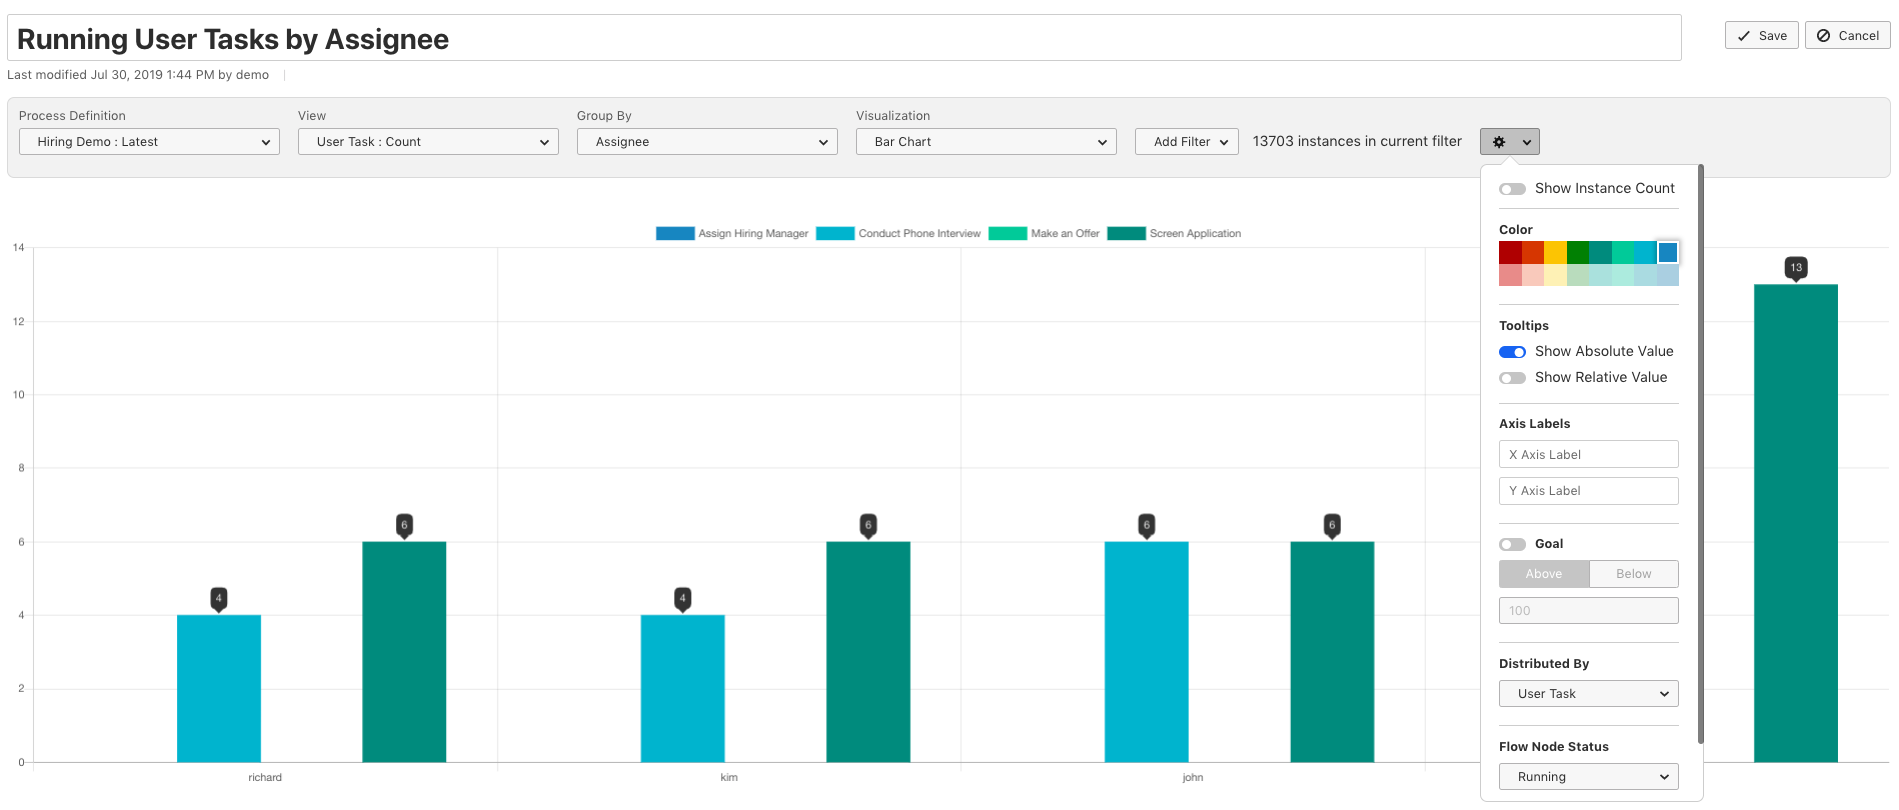
Sometimes you might want to look into completed User Tasks and analyze how many User Tasks have been completed by which assignee. This is possible by changing the Flow Node Status to completed in the configuration popover.
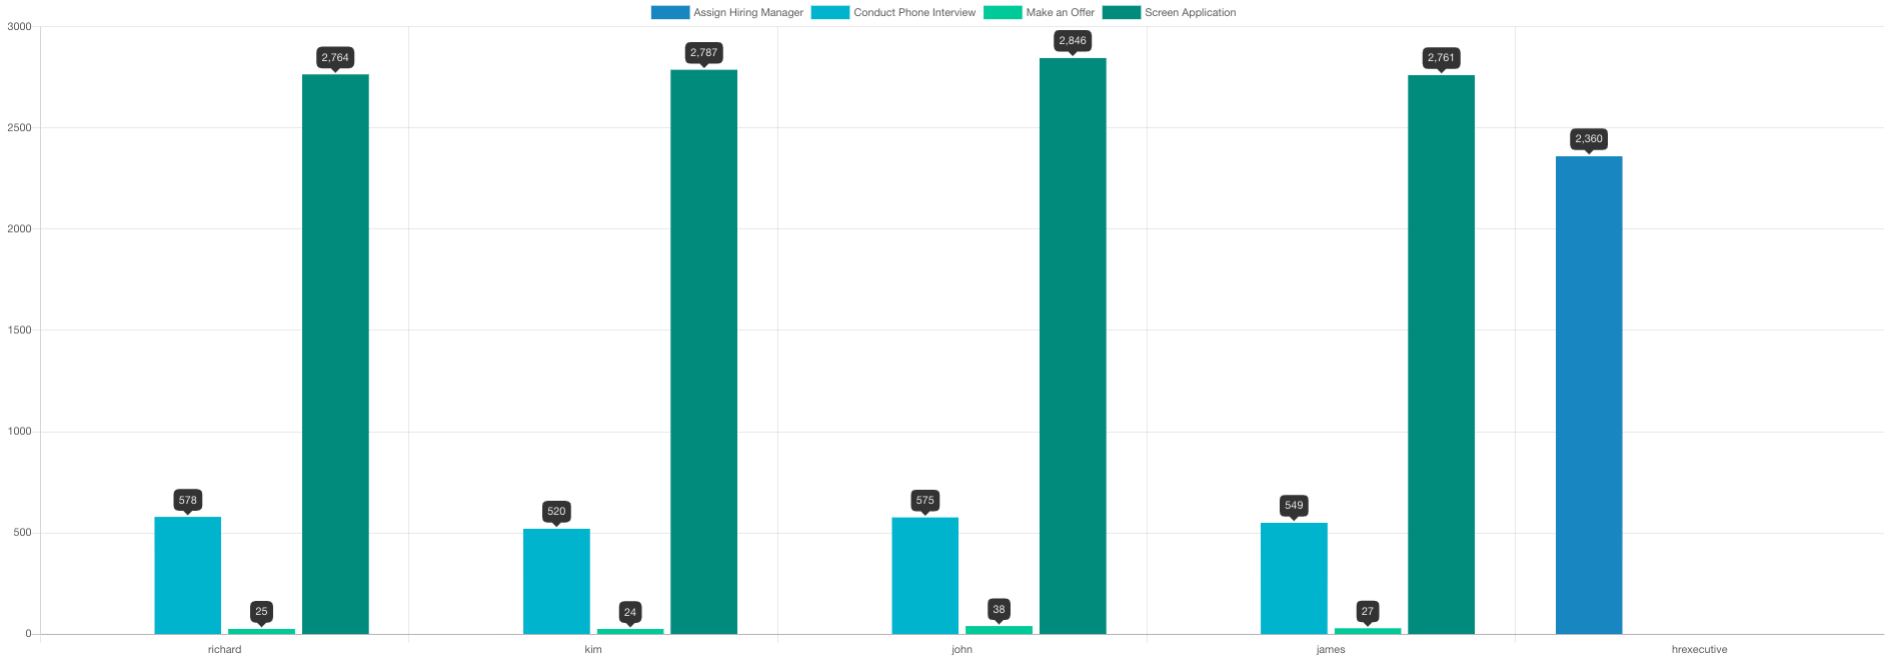
The same functionality is available for durations too.
Undefined and Null Variable Values
Variables are a very important ingredient of most workflows.
Optimize allows you to group process instance count and durations by variables and also includes powerful variable filtering possibilities. With this release we improve both areas.
Group by Variable: Null + Undefined Values
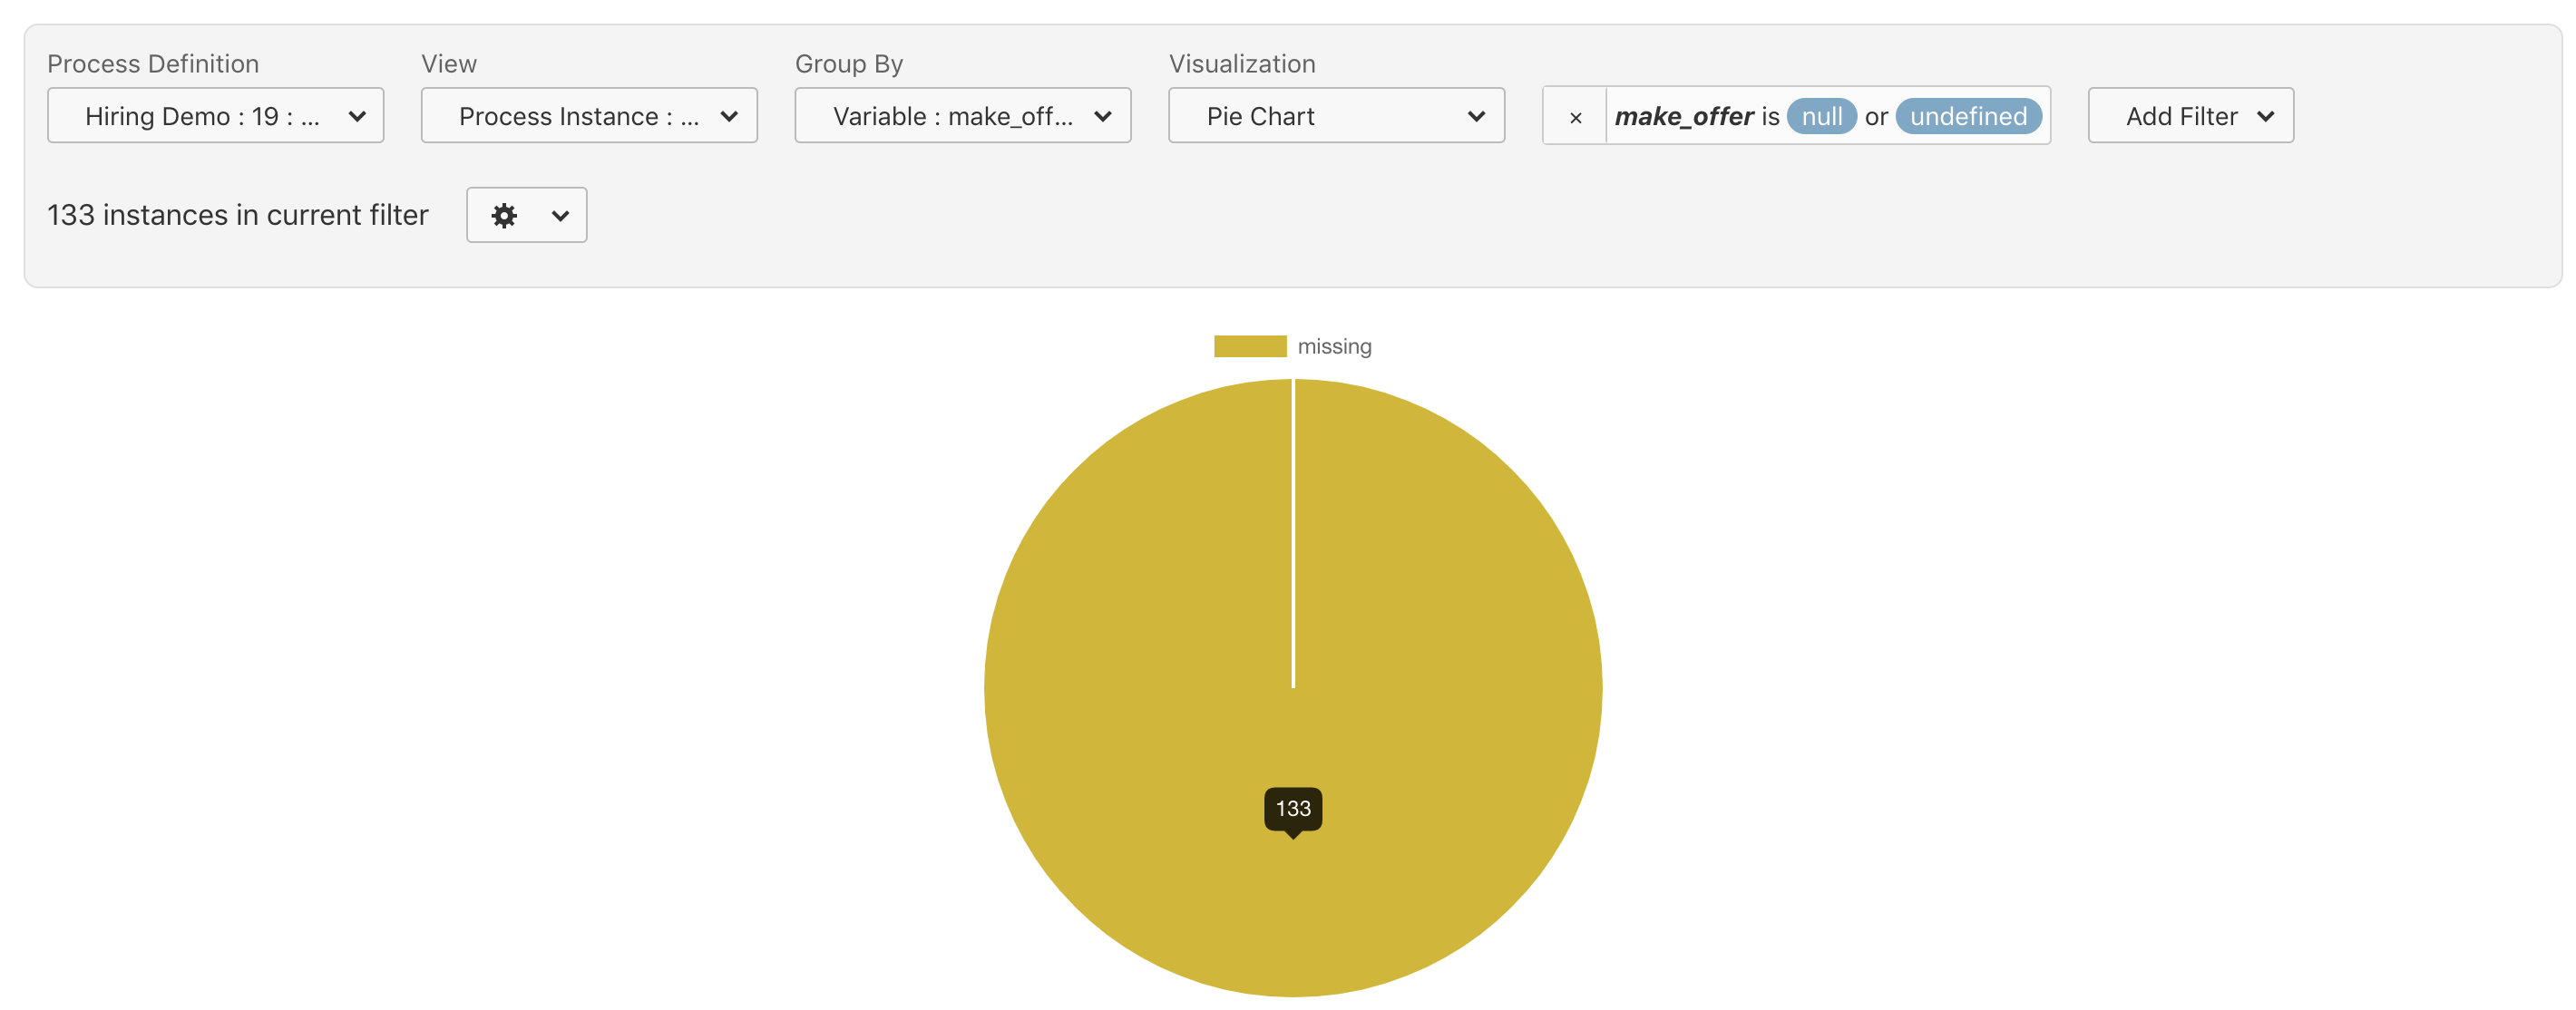
Before this release, when you grouped the process instance count or duration by a specific variable, you were only able to see process instances where a value was set. With this release Optimize will display the count and duration for process instances where no value is set or a variable has been set explicitly to null.
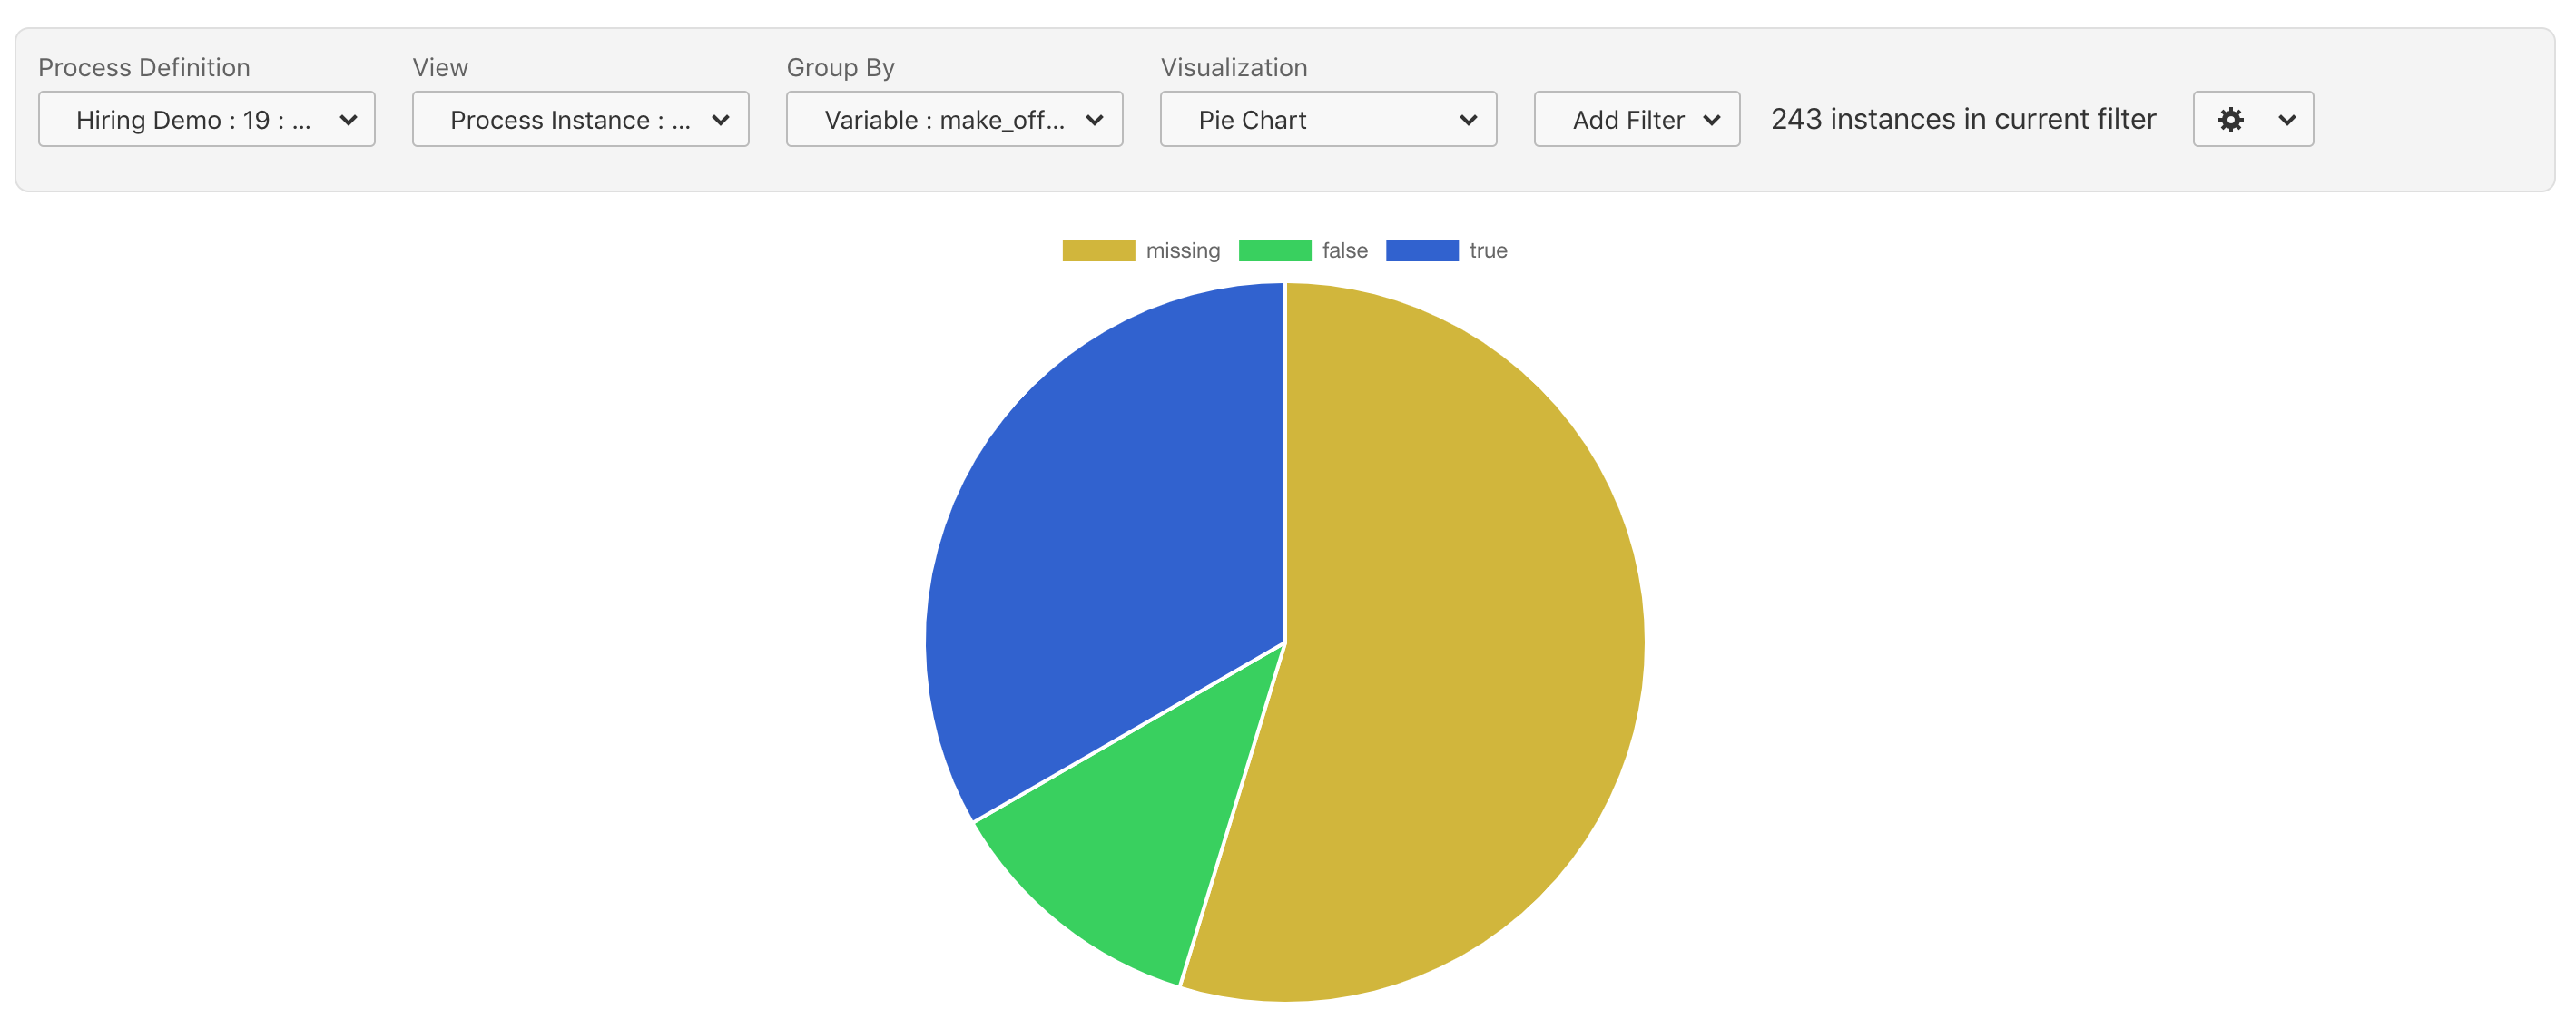
Filter Process Instances by Null and Undefined Variable Values
In certain scenarios it is necessary to find out which process instances have a null value.
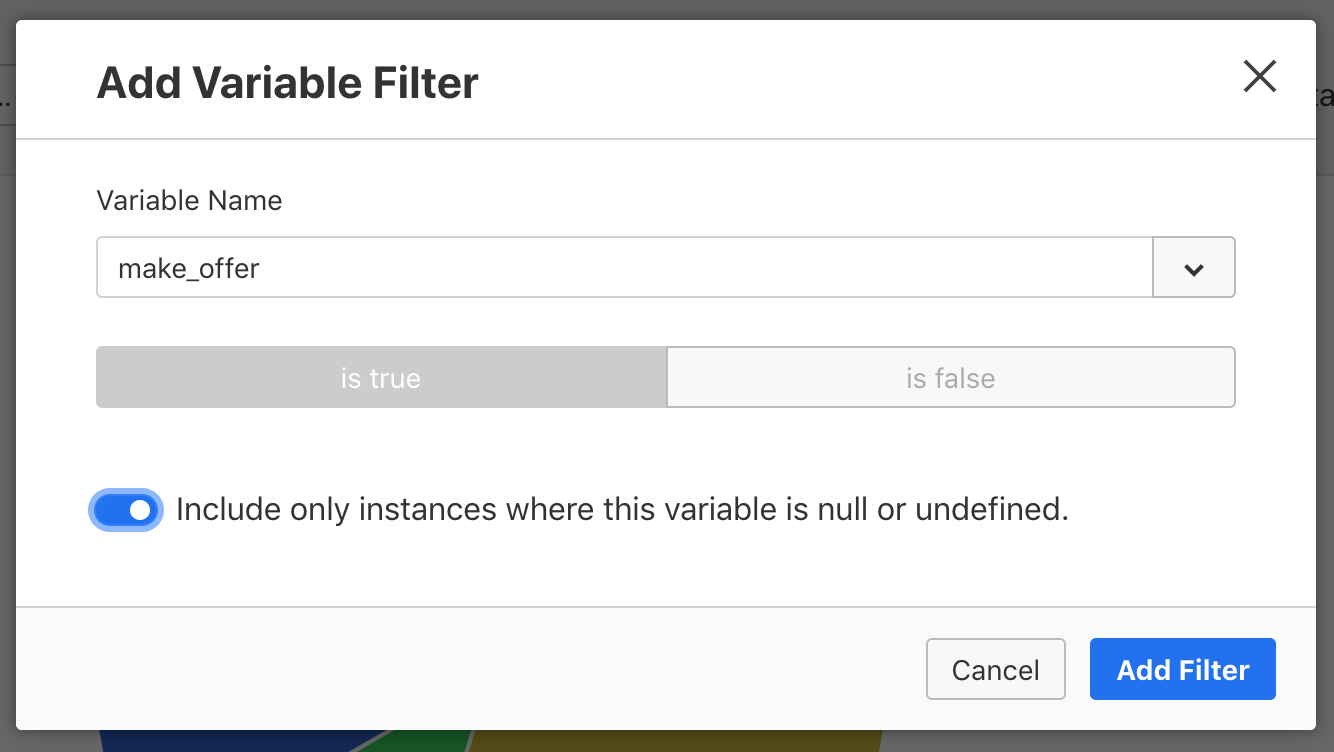
With this release we add the possibility for every supported data type to filter for null and undefined variable values.
Supported Docker Image
With this release we also add an officially supported Docker Image for Optimize to our Camunda Docker Registry.
This will enable you to quickly run Optimize in environments where you are making use of Docker already.
In order to use the Camunda Docker Registry you first have to login with your Enterprise Credentials:
docker login registry.camunda.cloud
Username: your_username
Password: ******
Login Succeeded
Afterwards you can start Optimize for example like this:
docker run -d --name optimize -p 8090:8090 -p 8091:8091
           -e OPTIMIZE_CAMUNDABPM_REST_URL=https://example.org/engine-rest
           registry.camunda.cloud/optimize:2.6.0
You can find detailed documentation about the configuration of the container in our Optimize documentation.
How to get it
If you want to give the new Camunda Optimize a try, you can download the release with your Enterprise customer credentials. Camunda Optimize is part of Camunda Enterprise, so please sign up for a free 30-day trial version.
If you’re new to Optimize, we recommend that you watch the Getting Started with Optimize in less than 5 Minutes video.
If you’re running an older Optimize version in production, we recommend checking out the update guide.
Register for the Webinar
We are running a free release webinar on October 8th and would be excited to have you there. See us demonstrating the new features, ask questions and give feedback during the session. Sign up now.
