
We’re excited to announce the release of Camunda Optimize 3.9.0-alpha2.
Camunda Optimize provides business activity monitoring for workflows, supporting continuous process improvement by providing transparency into your automated workflows and decisions. Business-friendly reports, dashboards, and alerts make it possible to identify process bottlenecks, improve end-to-end processes, and evaluate the success of your process automation initiative.
If you’re a user of Camunda 7 – Enterprise Edition, you can download the Camunda Optimize 3.9.0-alpha2 release right away with your customer credentials.
If not, start your free 30-day trial of Camunda Platform 8, which includes Optimize.
What’s New?
Optimize 3.9.0-alpha2 gives you an out-of-the-box data overview to help you prioritize your improvement efforts, lets you set and track expressive KPIs in a central location, and is easier to install, configure, and monitor.
Management Dashboard
When you have 15 different processes, where do you focus your efforts? How do you gain a holistic picture? Do you look at 15 different dashboards, or do you create and manage a full set of multi-process dashboards?
We’re offering a solution for this problem with the Management Dashboard. It’s a standard dashboard that integrates data from all your processes.
A successful process is both fast and effective. Therefore, we’ve separated time and quality KPIs so you can see whether your processes are too fast or not fast enough.
Optimize can automatically sort your KPIs into Time and Quality, depending on the report configuration.
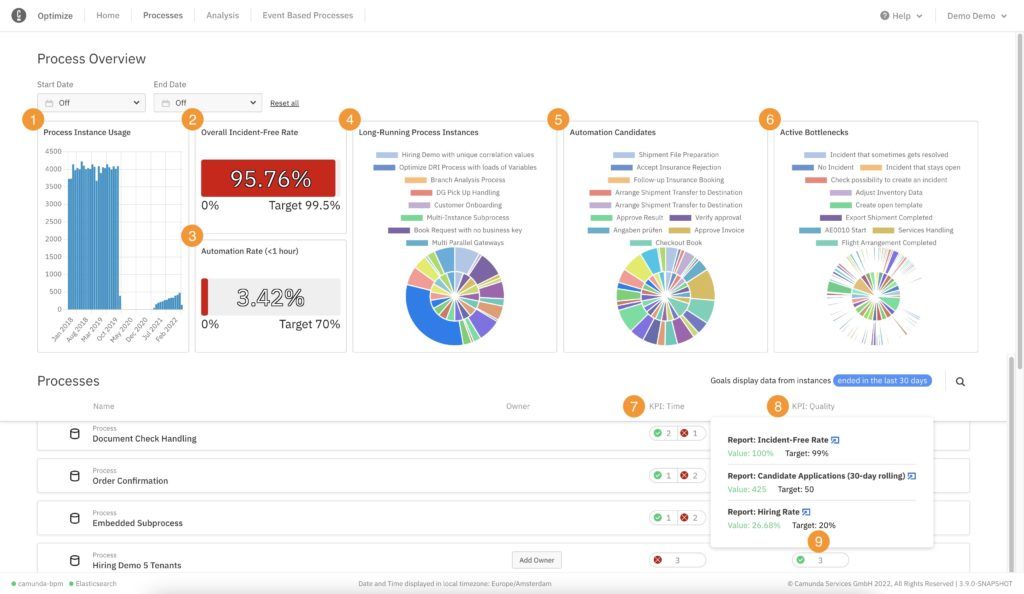
Here are the available views:
- Process Instance Usage: Track Camunda adoption by visualizing how many process instances were started each month.
- Overall Incident-Free Rate: Check the overall technical health of your processes by visualizing the percentage of process instances that did not have an incident.
- Automation Rate (<1 hour): View the percentage of process instances that are completed within one hour. This is a good proxy for how automated your entire suite of processes is.
- Long-Running Process Instances: View how many process instances that started over a week ago are still running. In addition, you can combine that with their average duration to identify the least efficient processes and potential pain points.
- Automation Candidates: View your most expensive user tasks by seeing how often they run next to their average duration.
- Active Bottlenecks: Identify the worst bottlenecks across any process in real-time by seeing the number of instances at any certain task and how long those instances have been there.
- Time KPIs: These are KPIs based on duration reports or percentage reports with a duration filter.
- Quality KPIs: These are KPIs based on other reports.
- KPI Results: You can see the KPI’s current and target values, plus a link to the report itself.
KPI Reports
Optimize 3.8 introduced the ability to set business goals on a limited number of metrics. This alpha release renames business goals to KPIs and lets you create a KPI based on almost any report visualized as a number (variable number reports aren’t supported yet).
Creating KPI Reports
New KPI templates are available when you create a new report. These are examples of KPIs you can track. You can create many more KPIs using our expressive report builder.
You’ll quickly be able to see whether a KPI has been met, based on the color of its bar. This comes in handy when you’re showing a set of five KPIs as part of your dashboard, where two of them need to be under a certain threshold and three have to be above.
Tracking and Modifying KPI Reports
Finally, when you look at the Processes page, you’ll be able to see whether processes are meeting their KPIs and compare the current value with the target value.
You can present the Processes page or share your dashboard with business stakeholders to find the right threshold. If you need to make a change, just follow a link on the Processes page to the actual report.
Putting it all together
To quickly get started with these new KPI reports, you can use the updated “process performance overview” template, which contains five sample KPIs. After you save the dashboard, you can immediately check the status on the Processes page.
Spring Boot Migration
Developers rejoice! Optimize has upgraded from a Spring to a Spring Boot application! For those business-minded stakeholders, here are the differences you need to know. Even more importantly, you can now benefit from simpler configuration, metrics, and faster development speed.
The initial motivations behind the upgrade from Spring to Spring Boot were to align with other Camunda products and open the way to implement new features using tools only available in Spring Boot.
Thanks to Spring Boot’s magic, we reduced the codebase by removing a significant amount of boilerplate code, got rid of XML-based configuration, and made the overall application and test configuration much more straightforward. Spring Boot also opens the doors for further optimization of our codebase which we will address in the future.
Besides that, we are looking forward to using the Actuator, a Spring Boot subproject for monitoring and collecting metrics of an application. We plan to measure import and query performance to allow our customers to see how Optimize is doing at any time.
What’s Next?
We’ll release the next alpha of Camunda Optimize 3.9.0 in July 2022. Stay tuned.
There should be a smooth update from Camunda Optimize 3.8.0 to Optimize 3.9.0. Along with the minor release, we’ll publish a dedicated update guide.
How to Get It
If you are a user of Camunda 7 – Enterprise Edition and want to give Camunda Optimize a try, you can download the release with your customer credentials.
Not a user yet? Sign up for a free 30-day trial of Camunda 8.
If you’re new to Optimize, here’s what you need to know to get started with Camunda Optimize.