

Understand how Camunda provides complete visibility to help you analyze process health and performance.
Designing, testing, deploying and automating your process are only the first steps in your digital transformation in the process development lifecycle―now it’s time to improve and optimize your process to make it the most effective it can be for your organization. This means studying historical data to look for bottlenecks in the process as well as verifying that all service level agreements (SLAs) are being achieved/met. Having the right tools to show to business to initiate a dialog around continuous improvement are key to opening this conversation with the right data for discussion.
What is Camunda Optimize?
Camunda Optimize, a component of Camunda Platform 8, gives you the insights you need to improve every aspect of your automated business processes. Using expressive dashboards and reports, without coding required, you can unlock the details within your processes and decision tables for improvement. These visualizations can be shared with the appropriate stakeholders for greater visibility across the organization.
Why use Optimize for process intelligence?
Knowing how your process is performing is crucial for success. This means gaining insights into if you are hitting key performance indicators (KPIs), which steps are executed most frequently and if they are performing as expected, what is the average time to process each task, are there bottlenecks that can be improved, and more.
This is where Optimize comes in—providing integrated process intelligence to monitor and improve process health. With data-rich analytics, you get insights into every aspect of your business process. The aesthetics of reports and dashboards provide a rich visualization of what is happening so that you can dive deeper into why it is happening.
While processes run on the server, Optimize pulls data from Camunda and imports and stores that data in its own Elasticsearch instance. Once imported, complex analytical algorithms are used to populate reports and dashboards to help answer important business questions.
How do I use Optimize for continuous improvement?
Camunda Optimize provides pre-defined reports and dashboards to help you get started. Reports are based on a single visualization (process) and can be represented in charts or graphs, for example. Dashboards allow users to combine different reports into an aggregated visualization showing combinations of charts and graphs for a more holistic view with visibility to key stakeholders.
You can even configure alerts for any significant changes in process details or when a process hits a predefined critical value. Camunda provides a process digest, which is a scheduled email report that summarizes the current and previous state of KPI reports for a specific process.
Reports
To accelerate your optimization efforts, there are several pre-built reports that can meet the specific needs of your organization, including several different KPI reports and several more around process instance data including heatmaps, counts, and durations. These can be used as-is or you can create custom views for specific reports for your business.
It is important to define reports and dashboards that display the proper information to assist you in evaluating your process orchestration and its performance. You need to be confident that you are tracking the tasks and parts of your process that are relevant and that might expose any unknown issues or delays. This is the only way to use the information provided to continuously improve your processes and performance.
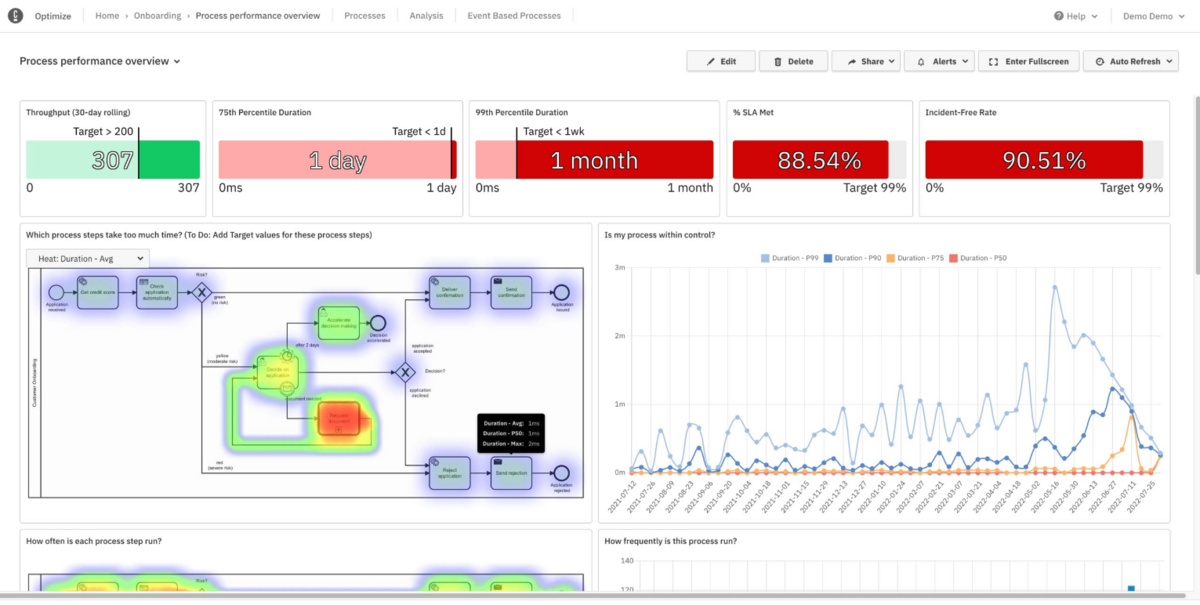
Let’s assume that you are tasked with determining if any specific steps in your process are taking more time than anticipated so steps can be taken to minimize that time to correct the issue. This may mean taking a deeper look at certain paths or steps to obtain more information about any process bottlenecks.
For example, if your insurance application process requires the completion of certain tasks for every instance, you might want to focus on the individual path(s) of concern to determine if you are processing more high, medium or low risk insurance applications. This can be done with a heatmap and applying filters to ignore certain nodes in the process. Using this insight, it may be determined that a different product offering might better suit the needs of certain demographics that are being served or if another business change is necessary.
By limiting the “noise” in your process, you can concentrate on the most important elements of the process to gain insight into your business. In this case, about 24% of our processes go through a manual determination of risk while we are automatically approving low-risk applications, making up just over 35% of our applications. Collectively, the approvals are around 53% (some manual risk determinations are being rejected). With this information, you can review our risk determination and our demographics around your applicants to determine if new offerings might be appropriate or if modifying the way we determine risk is in order.
You can also drill down to review branches of your process in more detail to gain insight into the process. For example, if you review the information below from a different process, it can be seen that from the 1,045 process instances that took the “yellow” (medium risk) path, only 671 were approved.
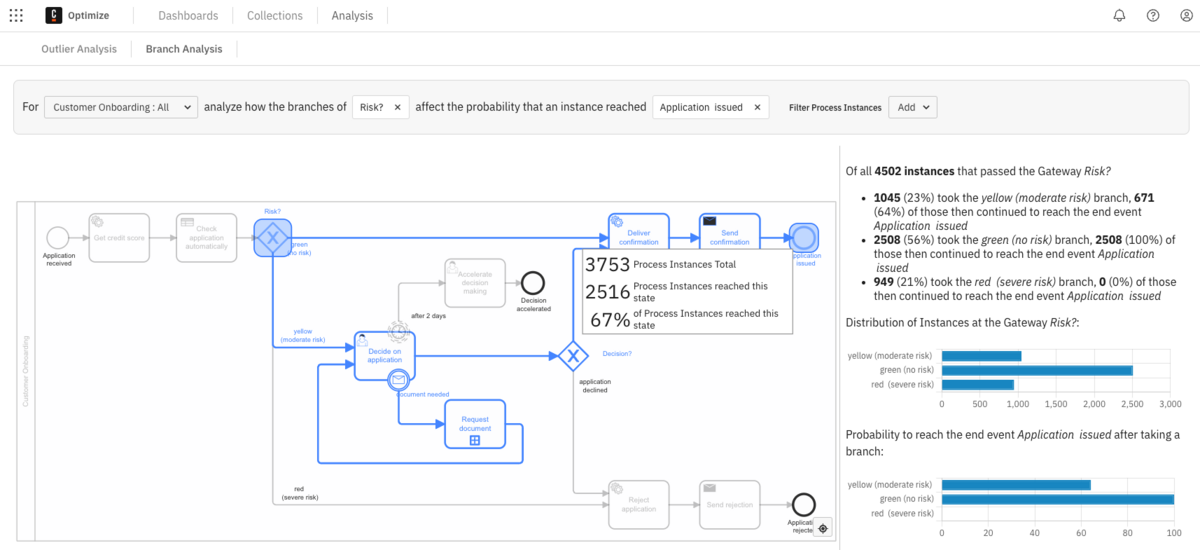
Having access to this detailed information helps provide insight into your process. In this case, you may want to dive down on how often there is a need for additional documentation before application approval as part of the medium risk path.
Dashboards
There are several dashboard templates available with a wide range of reports on each dashboard. Don’t forget, you can always create your own dashboards with your own reports. Camunda offers the “Process performance overview” for single processes and the “Operations monitoring dashboard” for multiple processes among others.
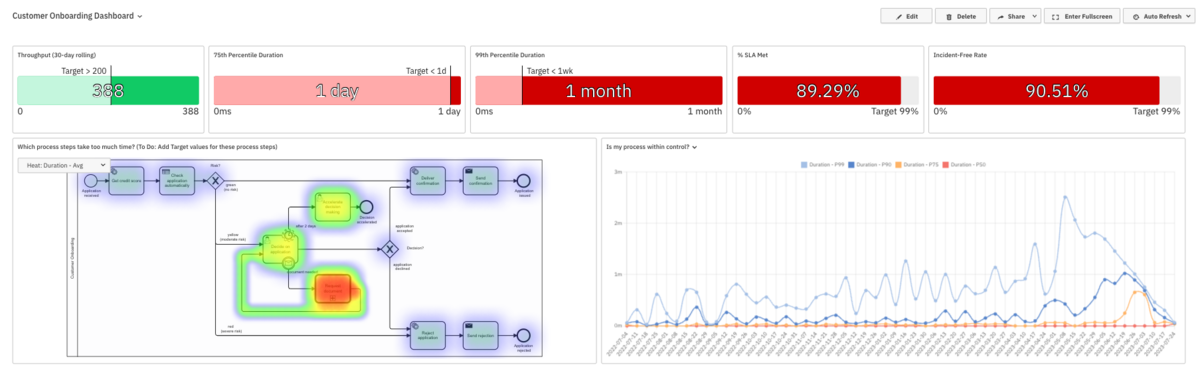
Dashboards provide an excellent snapshot of key metrics to quickly show the status of meeting targets and where there might be issues. Combining essential reports in an easy-to-consume single view is an outstanding way to provide a quick look into the status and performance of our process(es).
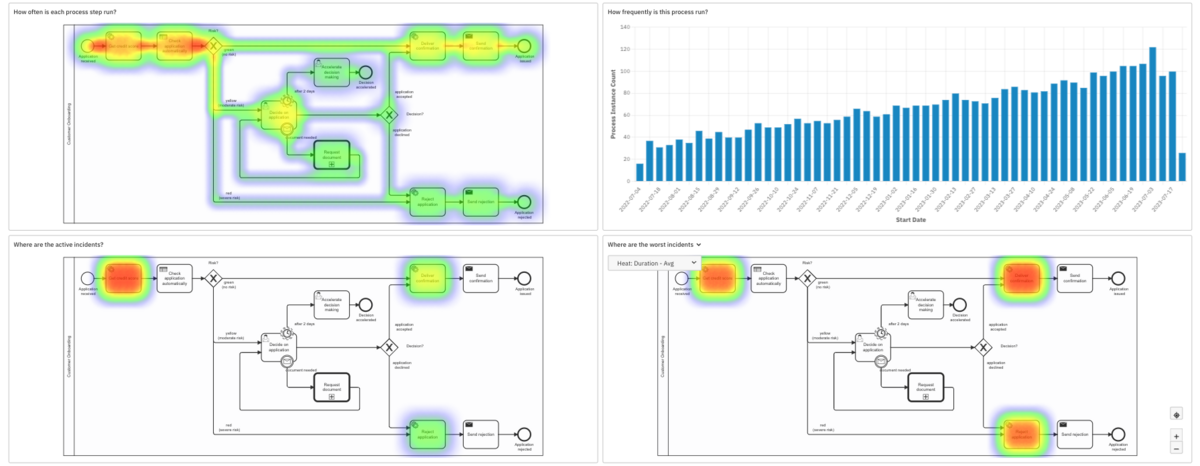
As shown in the example dashboard, you notice that along the top you are provided an instance view into how the process is doing on target metrics with color coding for easy identification. In the first heatmap on the left, you can also see that we do have a significant number of applications that require additional documentation in order to make a determination of acceptance. This is an opportunity to change our process to ask for this information initially as part of the application process.
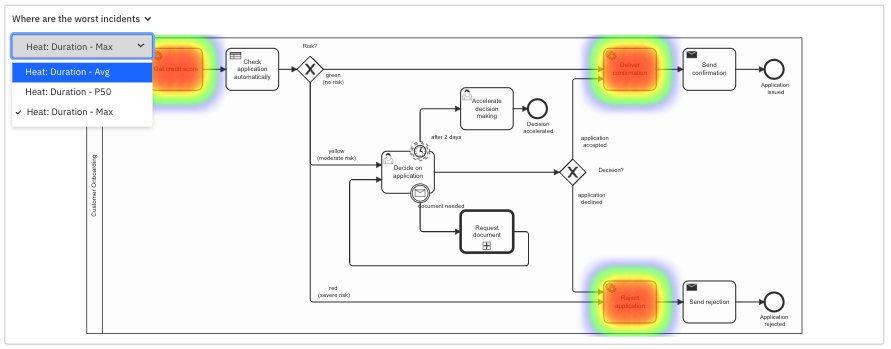
The reports on the dashboard can be reviewed and modified while viewing the dashboard by simply selecting a different view option from the menu.
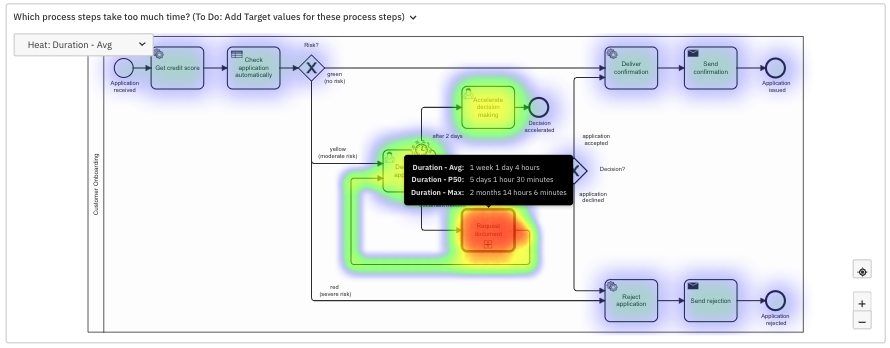
You can also dive deeper into the specific details on individual steps by hovering over certain components in the report on the dashboard.
You also want to make sure the right individuals have access to the information they need. You can share your dashboards easily from the Optimize interface. However, you may want to embed certain reports and dashboards in another application using the Optimize API. This approach allows you to get the right information in front of the right people to make data-driven decisions.
Expand your insight with machine learning-ready data sets
You may also want to incorporate data from other systems to provide an expanded view of what is happening within your organization. Optimize allows the export of process information into single raw data sets which is pre-processed and organized so that it is ready for trained models to make predictions, find trends, and gather other insight. These machine learning (ML) data sets contain additional columns of information from the process and are formatted in such a way (CSV or JSON format) that common data science packages can read them and apply algorithms.
Optimize your process automation with Camunda Optimize
Camunda Optimize positions your organization to benchmark, monitor, analyze, evaluate, and focus on continuous improvement to provide the best solution for your customers. By concentrating on continuous improvement, you can improve quality, increase efficiency, decrease costs and boost customer satisfaction. With Camunda, you can transform your organization towards a digital future.
Learn more about Optimize and get started with a free trial of Camunda today.
Read more
Looking to better understand the kinds of reports you can make with Optimize? Check out some great examples (including brief, easy-to-follow videos) right here.